

Advanced Reporting for Magento 2
 Community: 2.3.x, 2.4.x Enterprise: 2.3.x, 2.4.x

30 Days
Money Back

Highly Secure &
Stable Products

Free 9 Months
Upgrade

Free 90 Days
Support


- Details
- Features
- FAQs
- Reviews
- Features Request
Our Advanced Reports Magento 2 extension allows you to make complete use of your store's data. With comprehensive reporting, interactive dashboards, and real-time analytics, you can gain valuable insights into your customers, sales, and inventory. Make data-driven decisions, optimize your marketing strategies, and improve overall store performance. Our Magento 2 Advanced Reports extension is easy to install and use, providing you with the tools you need to succeed in today's competitive e-commerce landscape. This Magento 2 reporting extension ensures you have accurate, actionable insights at your fingertips.
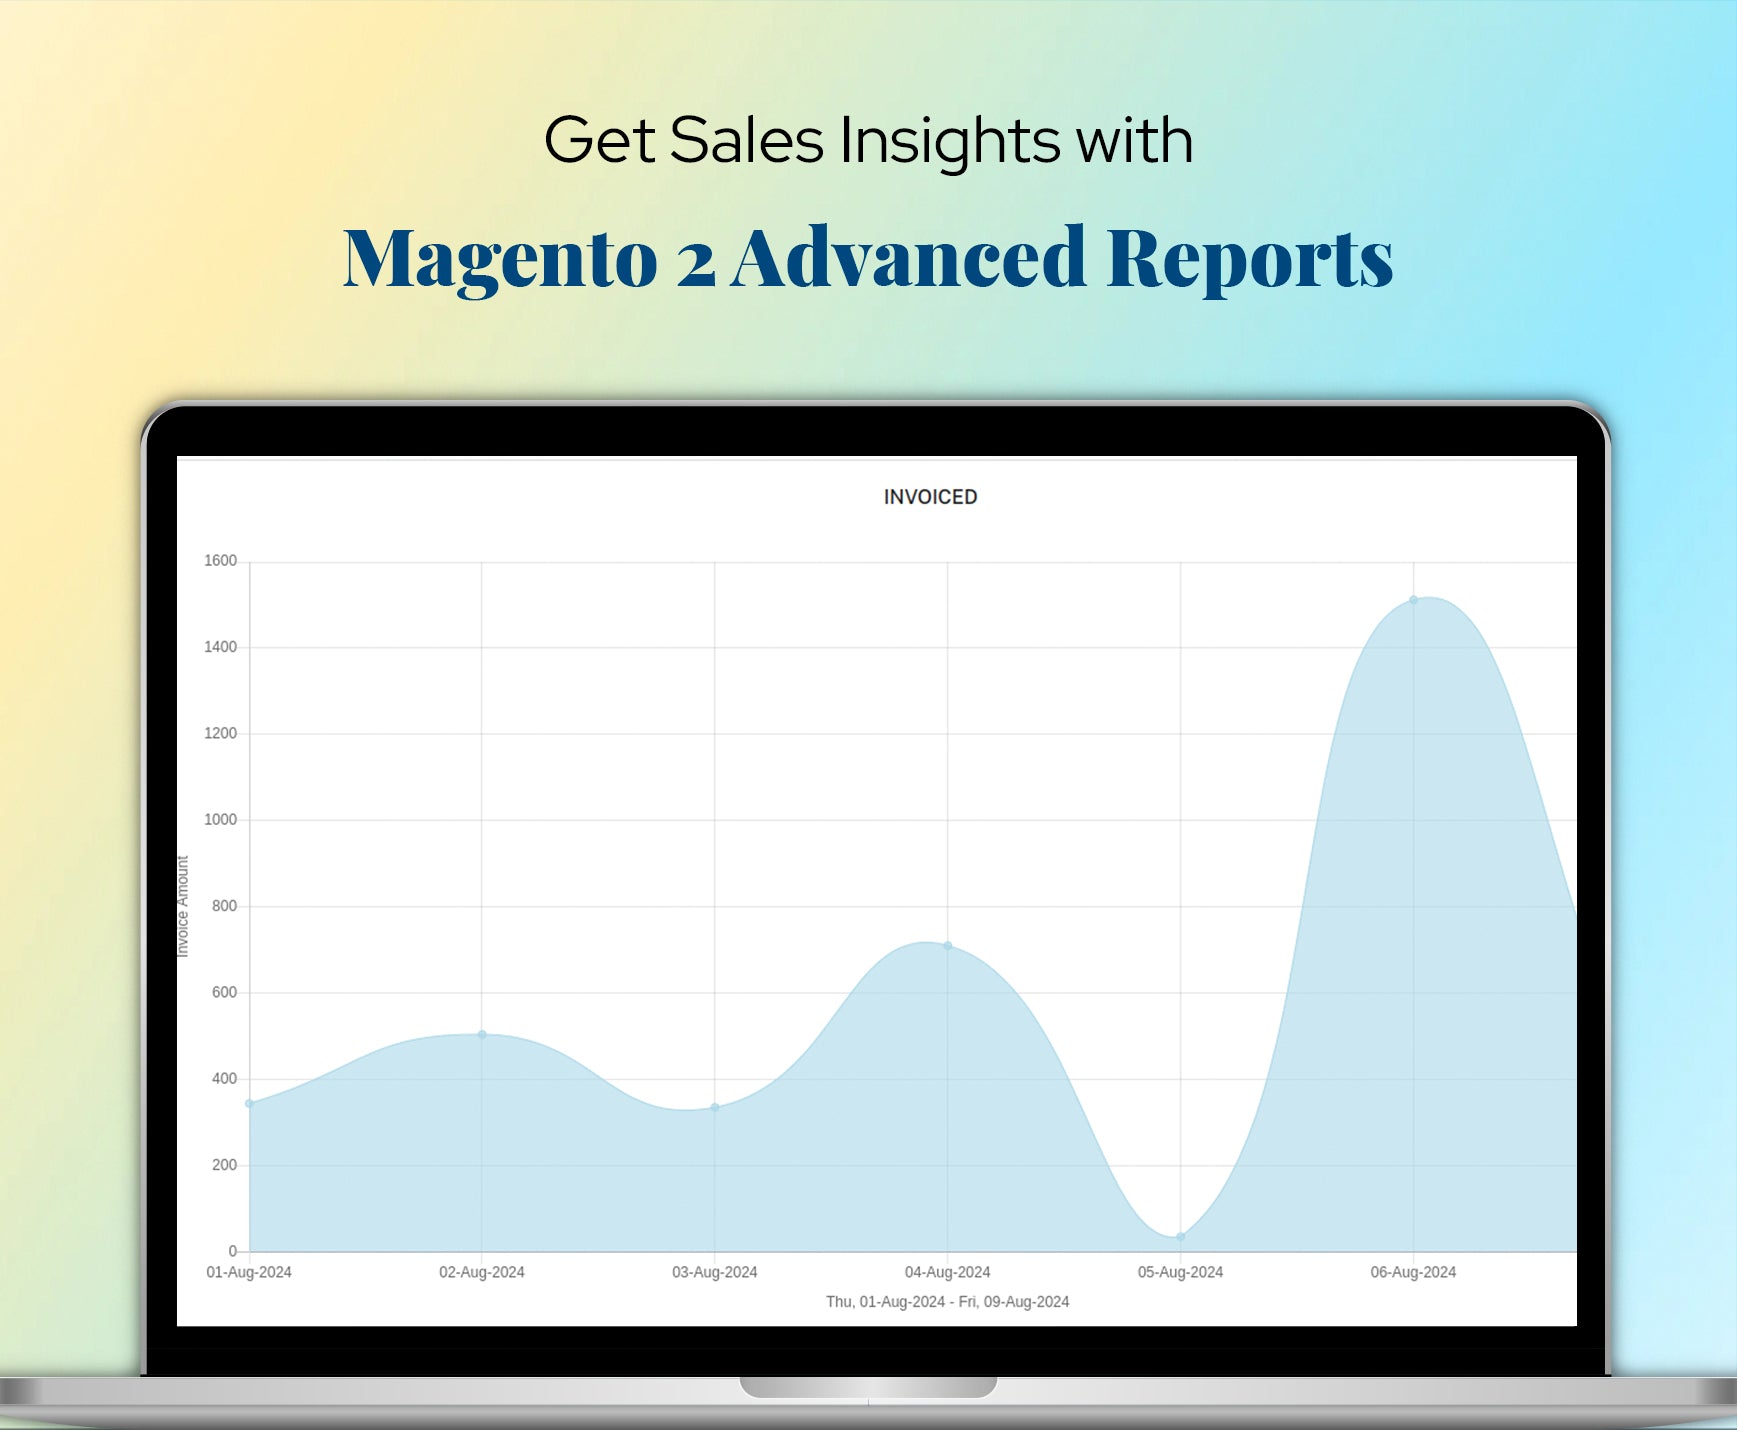
Get Sales Insights with Magento 2 Advanced Reports
Gain a deeper understanding of your store's sales performance with our Advanced Reports for Magento 2 extension. Analyze sales trends, identify top-selling products, and discover opportunities to maximize revenue. With real-time data and customizable reports, you can make informed decisions to boost your sales and drive growth.

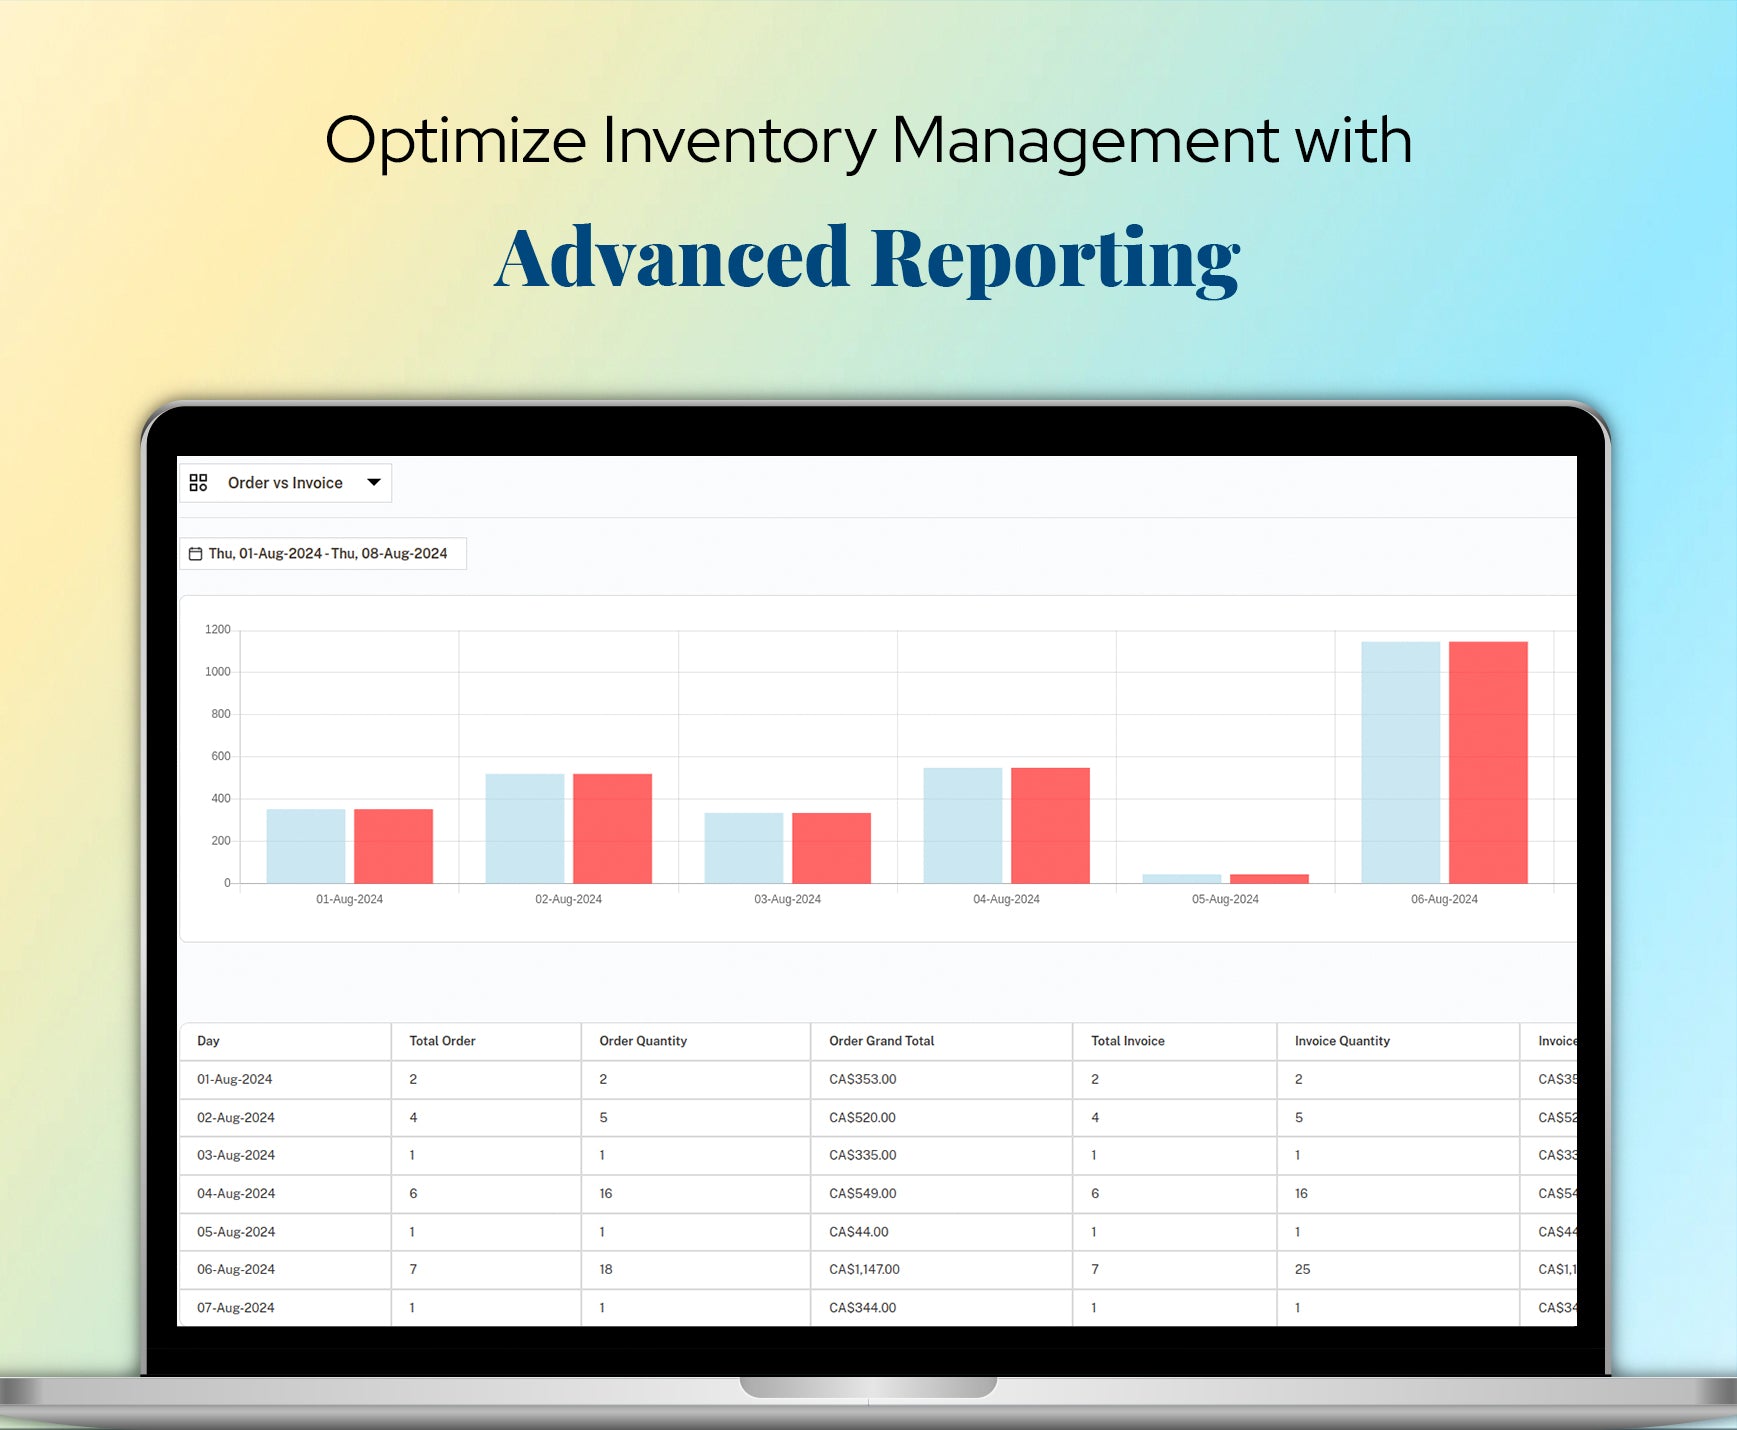
Optimize Inventory Management with Advanced Reporting
Prevent stockouts and reduce overstocking with the Advanced Reports For Magento 2 extension. Access detailed inventory reports that help you track stock levels, understand product demand, and optimize your inventory management. Make data-driven decisions to maintain the right stock levels and improve your store's efficiency Magento 2 Reporting Extension..
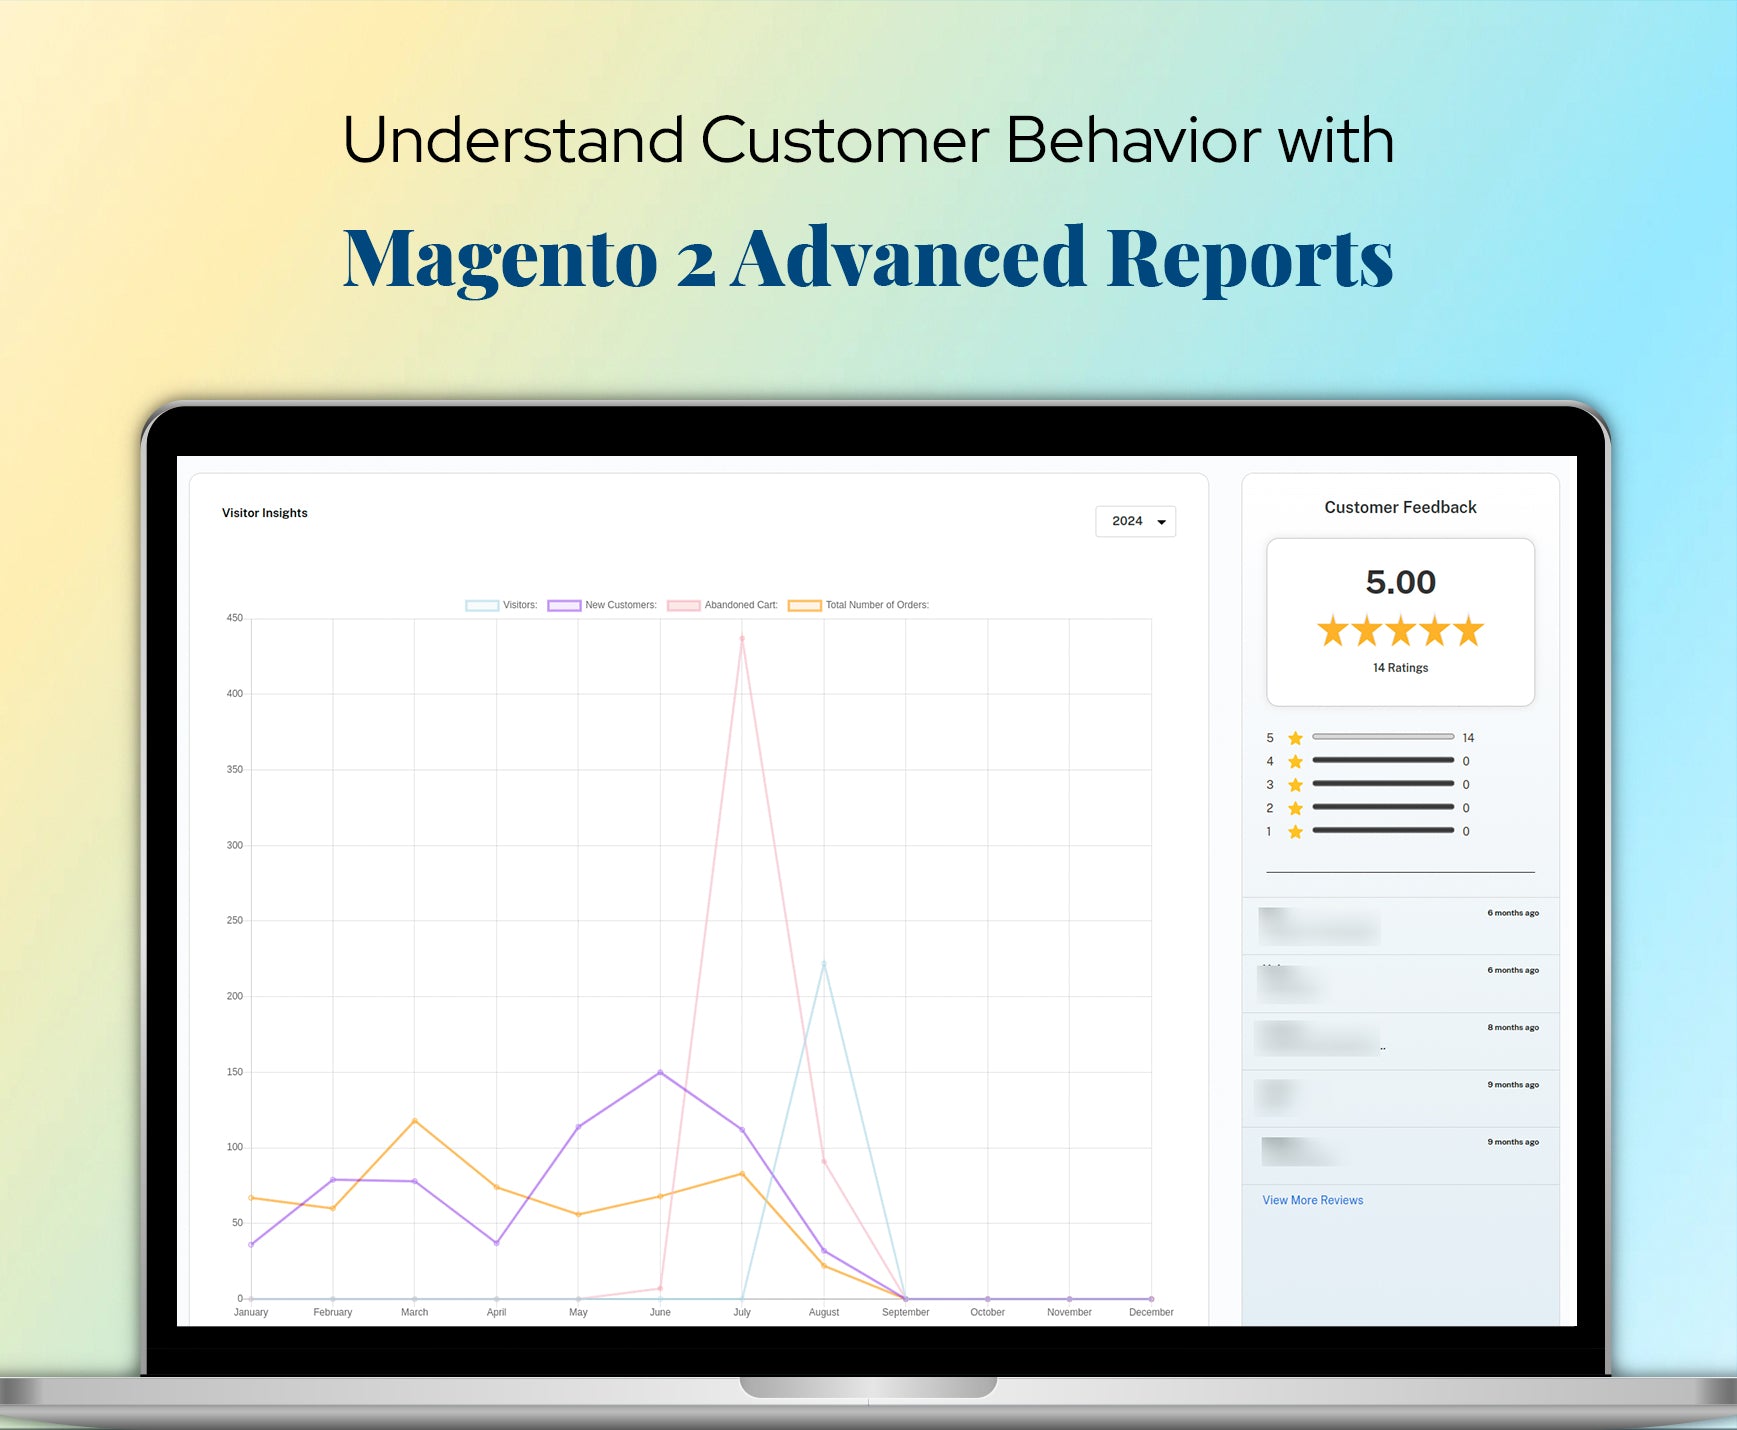
Understand Customer Behavior with Magento 2 Advanced Reports
Get to know your customers better with comprehensive customer behavior analysis. Our Magento 2 Advanced reports extension allows you to track customer purchasing habits, segment your audience, and personalize your marketing efforts. Use these insights to build stronger customer relationships and increase loyalty.

Measure Marketing Campaign Success with Data-Driven Reports
Evaluate the effectiveness of your marketing campaigns with precise data from Magento 2 Advanced reports extension. Track campaign performance, measure ROI, and identify areas for improvement. Leverage these insights to refine your marketing strategies and achieve better results.

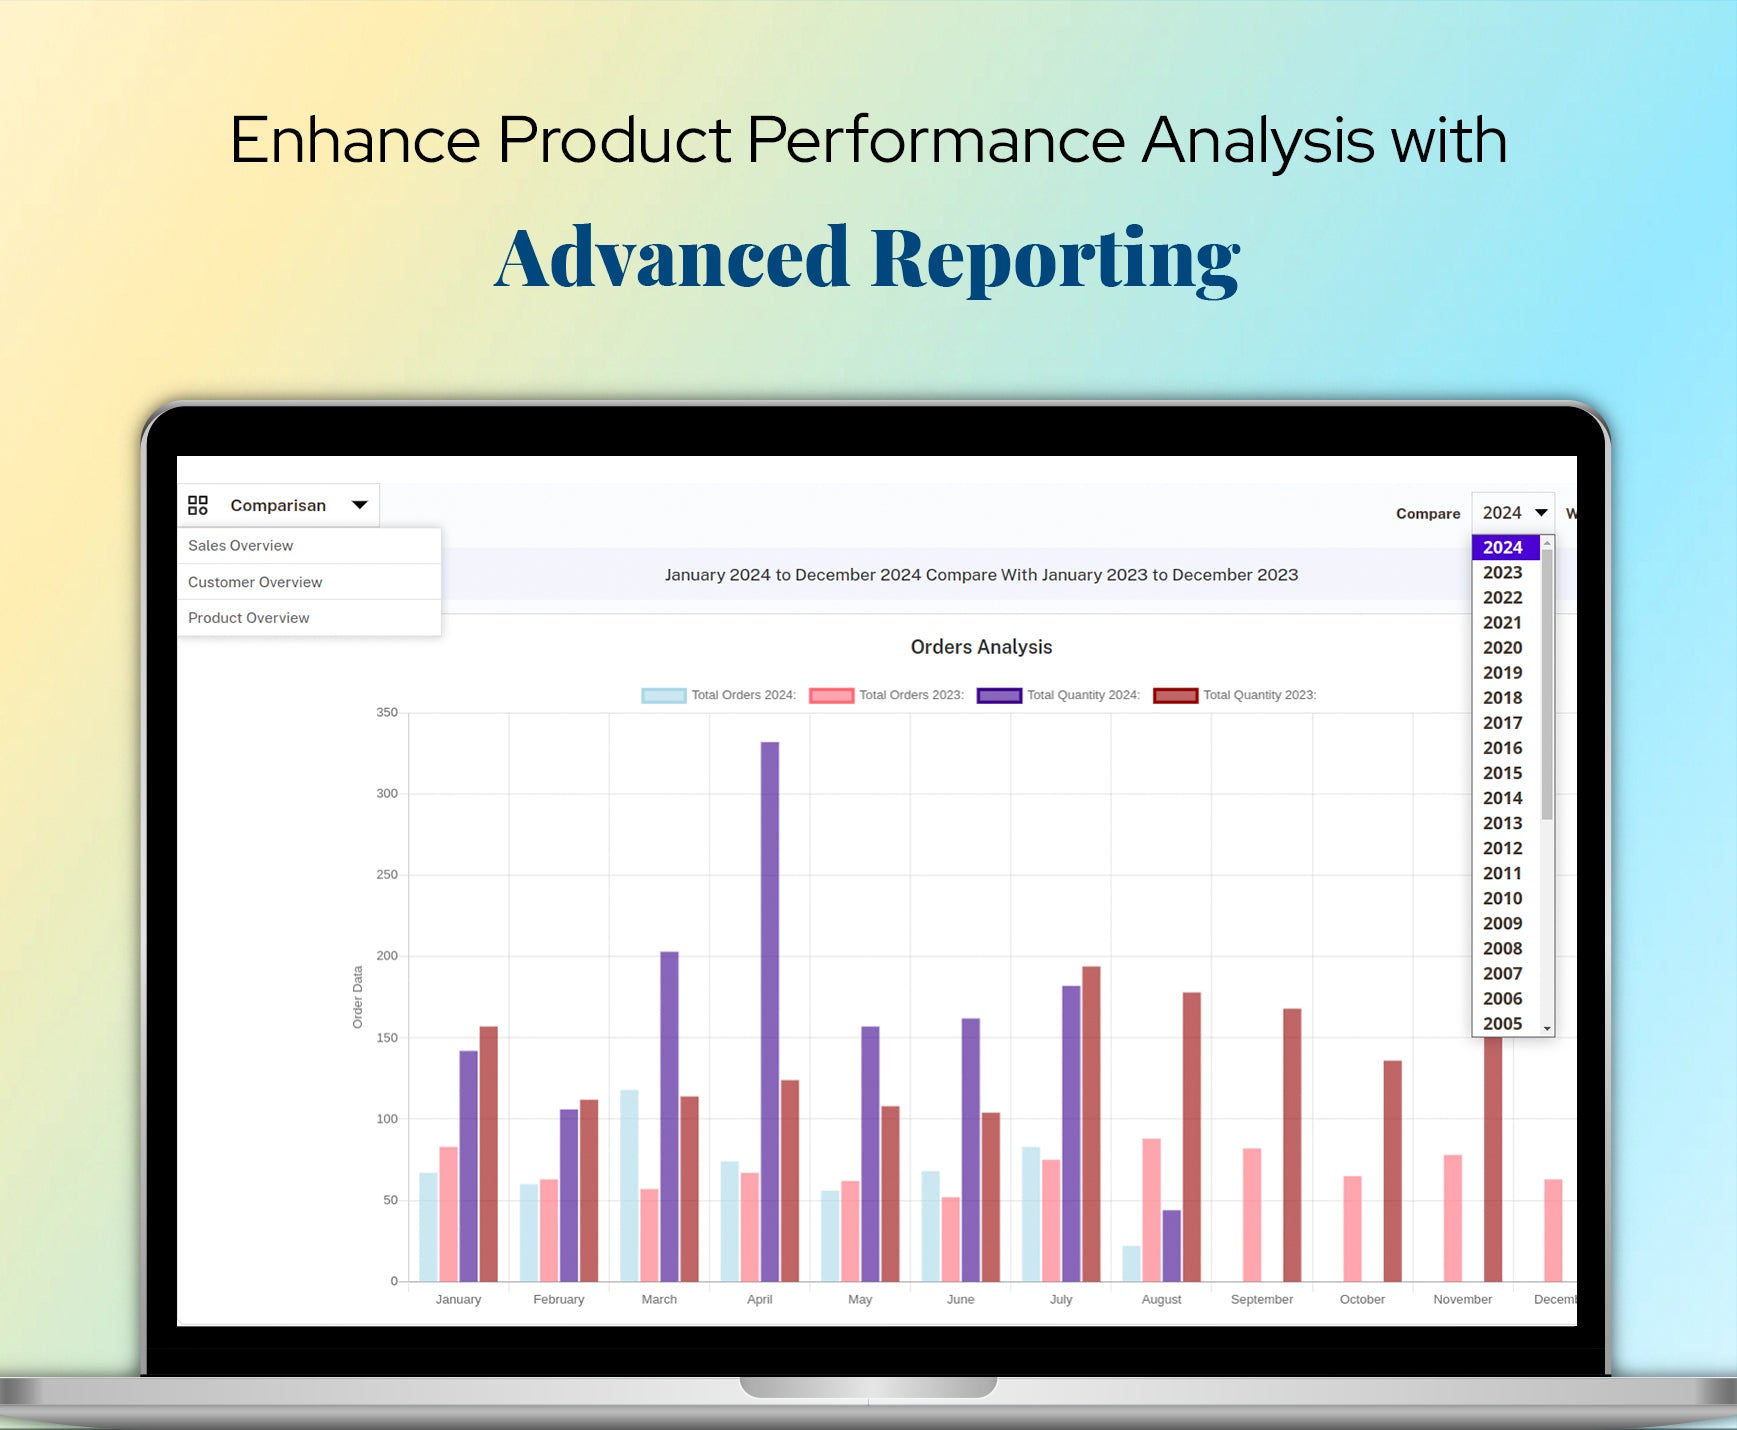
Enhance Product Performance Analysis with Advanced Reporting
Discover which products drive the most revenue with Advanced Reports Magento 2. Analyze product performance, identify best-sellers, and spot trends to optimize your product offerings. Use this data to make strategic decisions that boost your store's profitability.
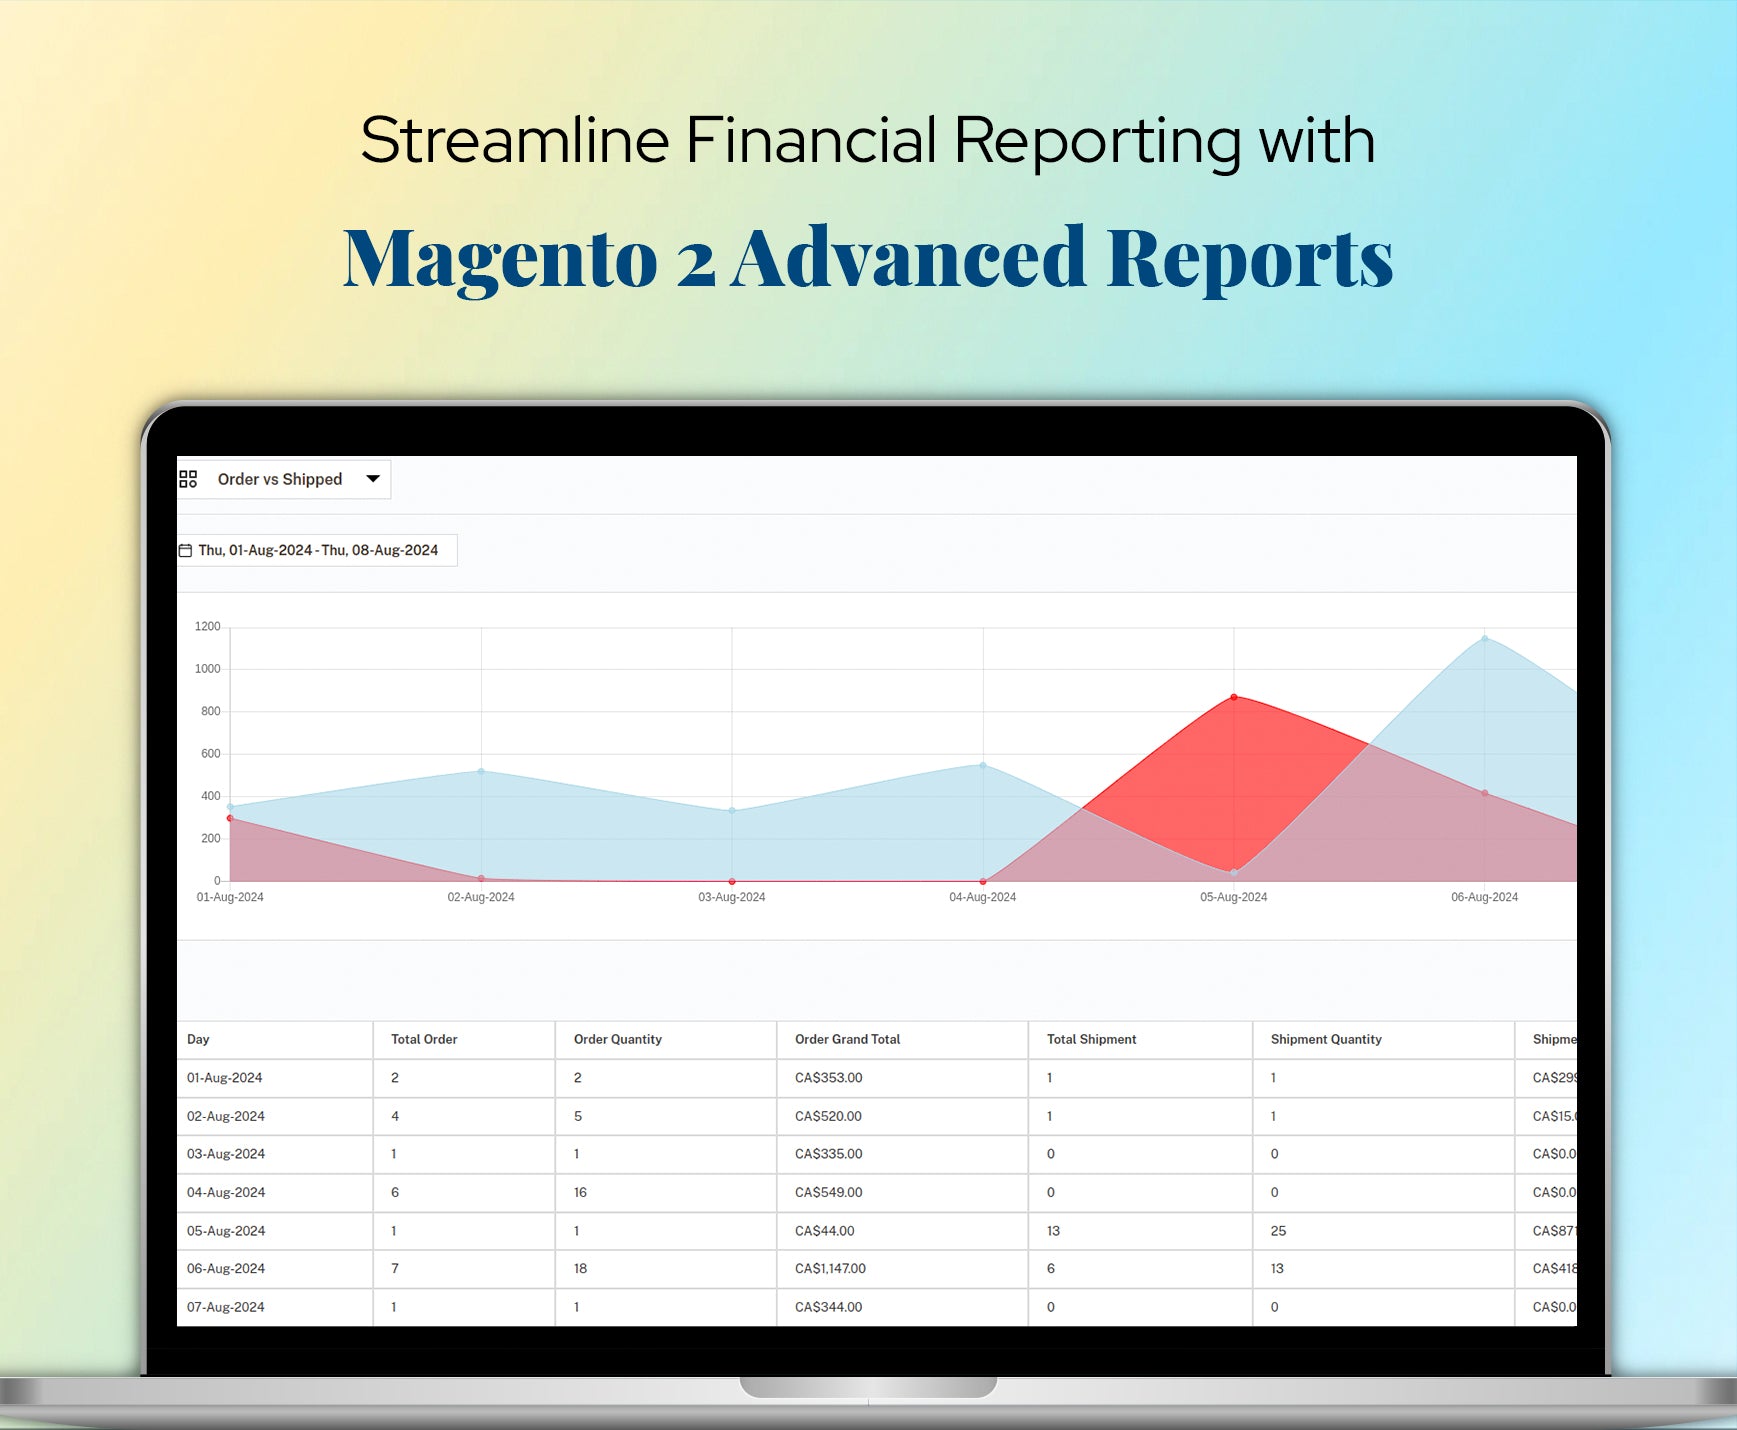
Streamline Financial Reporting with Magento 2 Advanced Reports
Simplify your financial reporting with the powerful tools provided by Magento 2 Reporting Extension. Access detailed financial reports, track revenue, monitor expenses, and ensure accurate financial management. Save time and improve accuracy with automated reporting features.

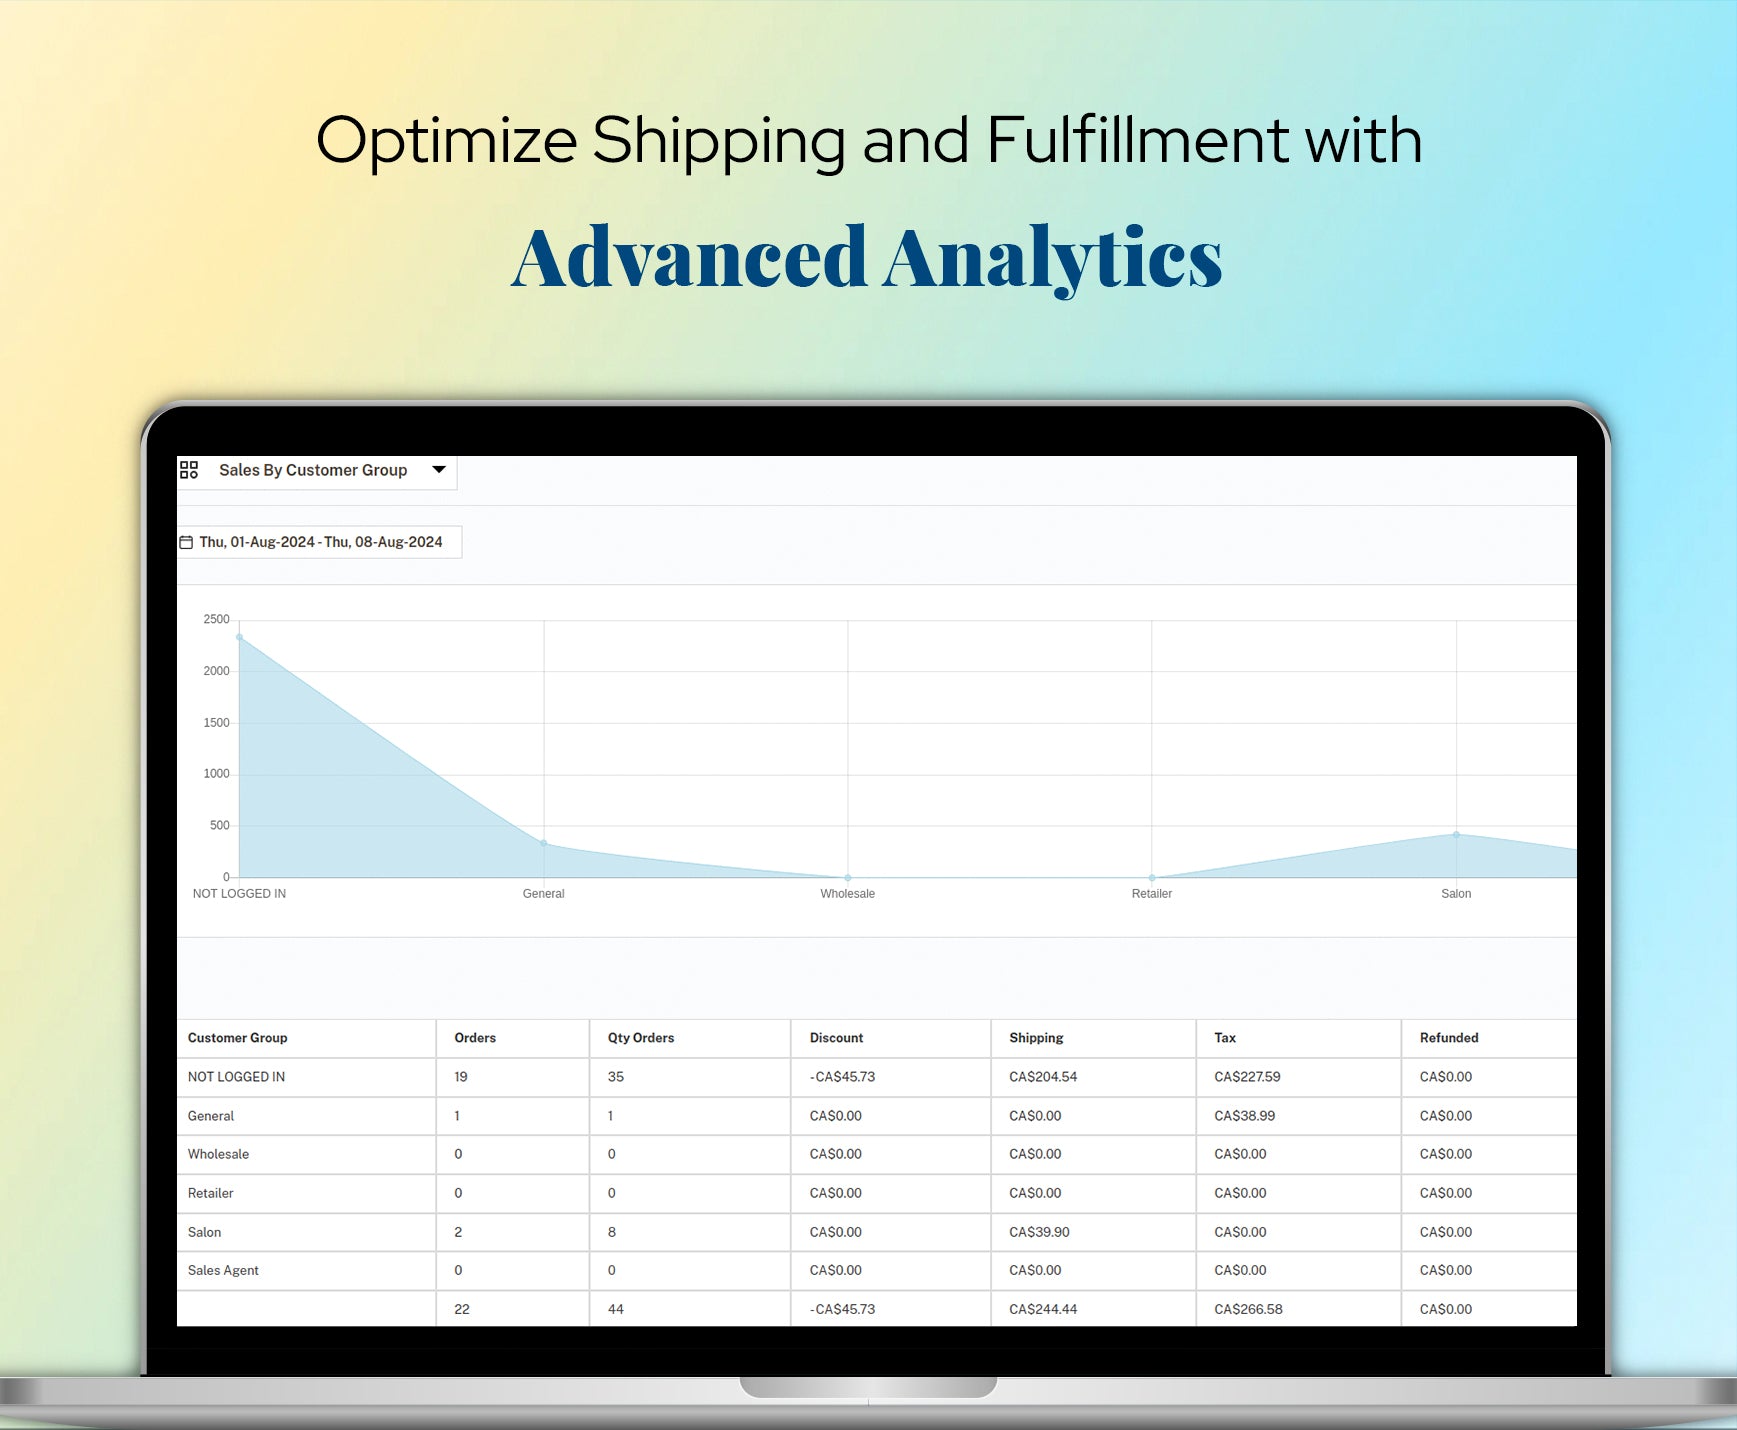
Optimize Shipping and Fulfillment with Advanced Analytics
Improve your shipping and fulfillment processes with actionable insights from Magento 2 Reports extension. Track order fulfillment rates, shipping costs, and delivery times to enhance customer satisfaction and reduce operational costs. Use this data to streamline your logistics and boost efficiency.
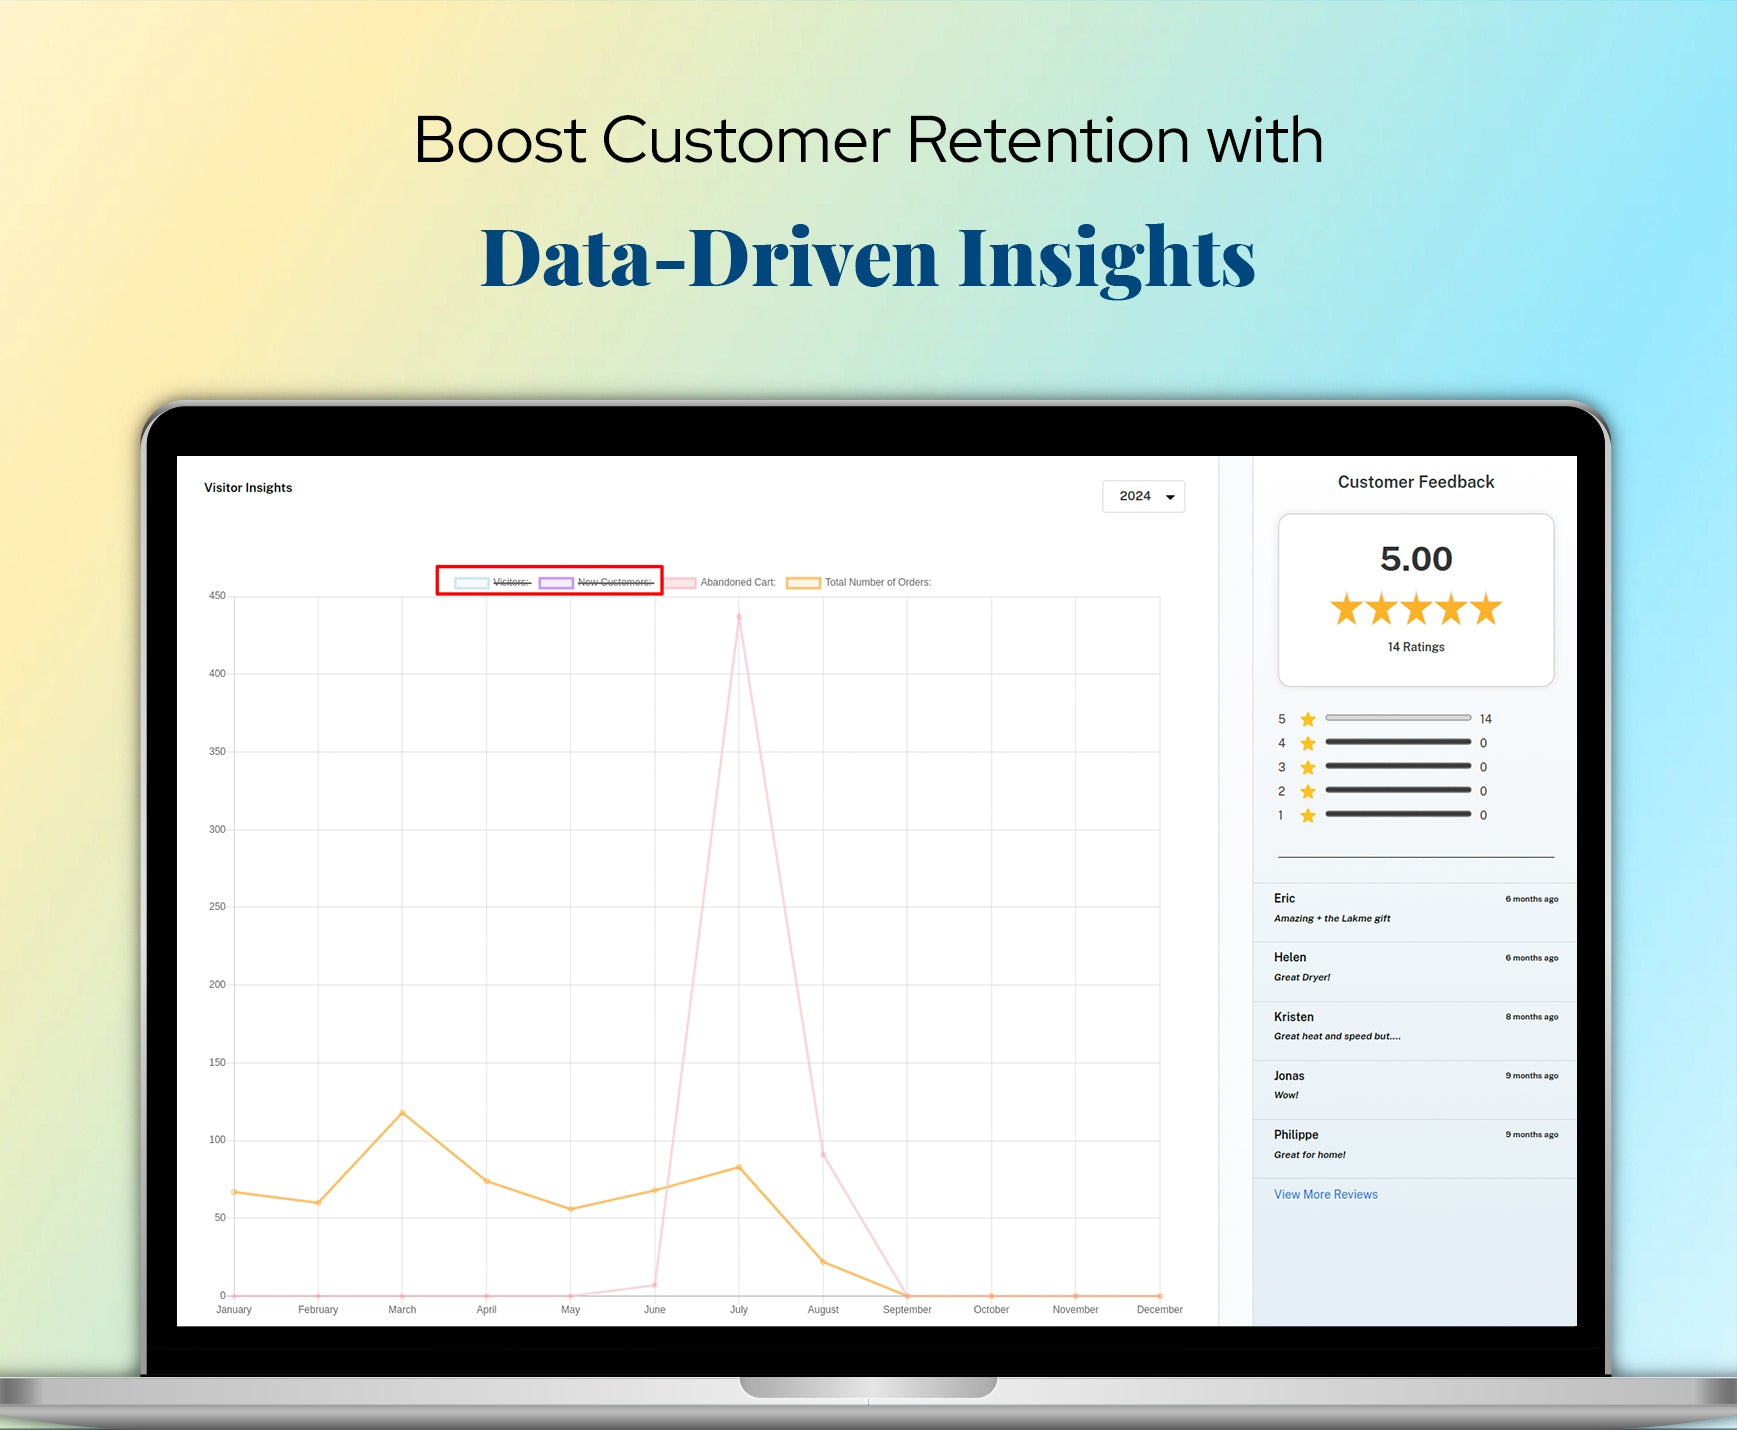
Boost Customer Retention with Data-Driven Insights
Retain more customers by understanding their needs and preferences with Magento Reporting Extensions. Analyze customer retention metrics, identify at-risk customers, and implement targeted strategies to keep them engaged. Strengthen customer loyalty and drive repeat business with data-backed decisions.

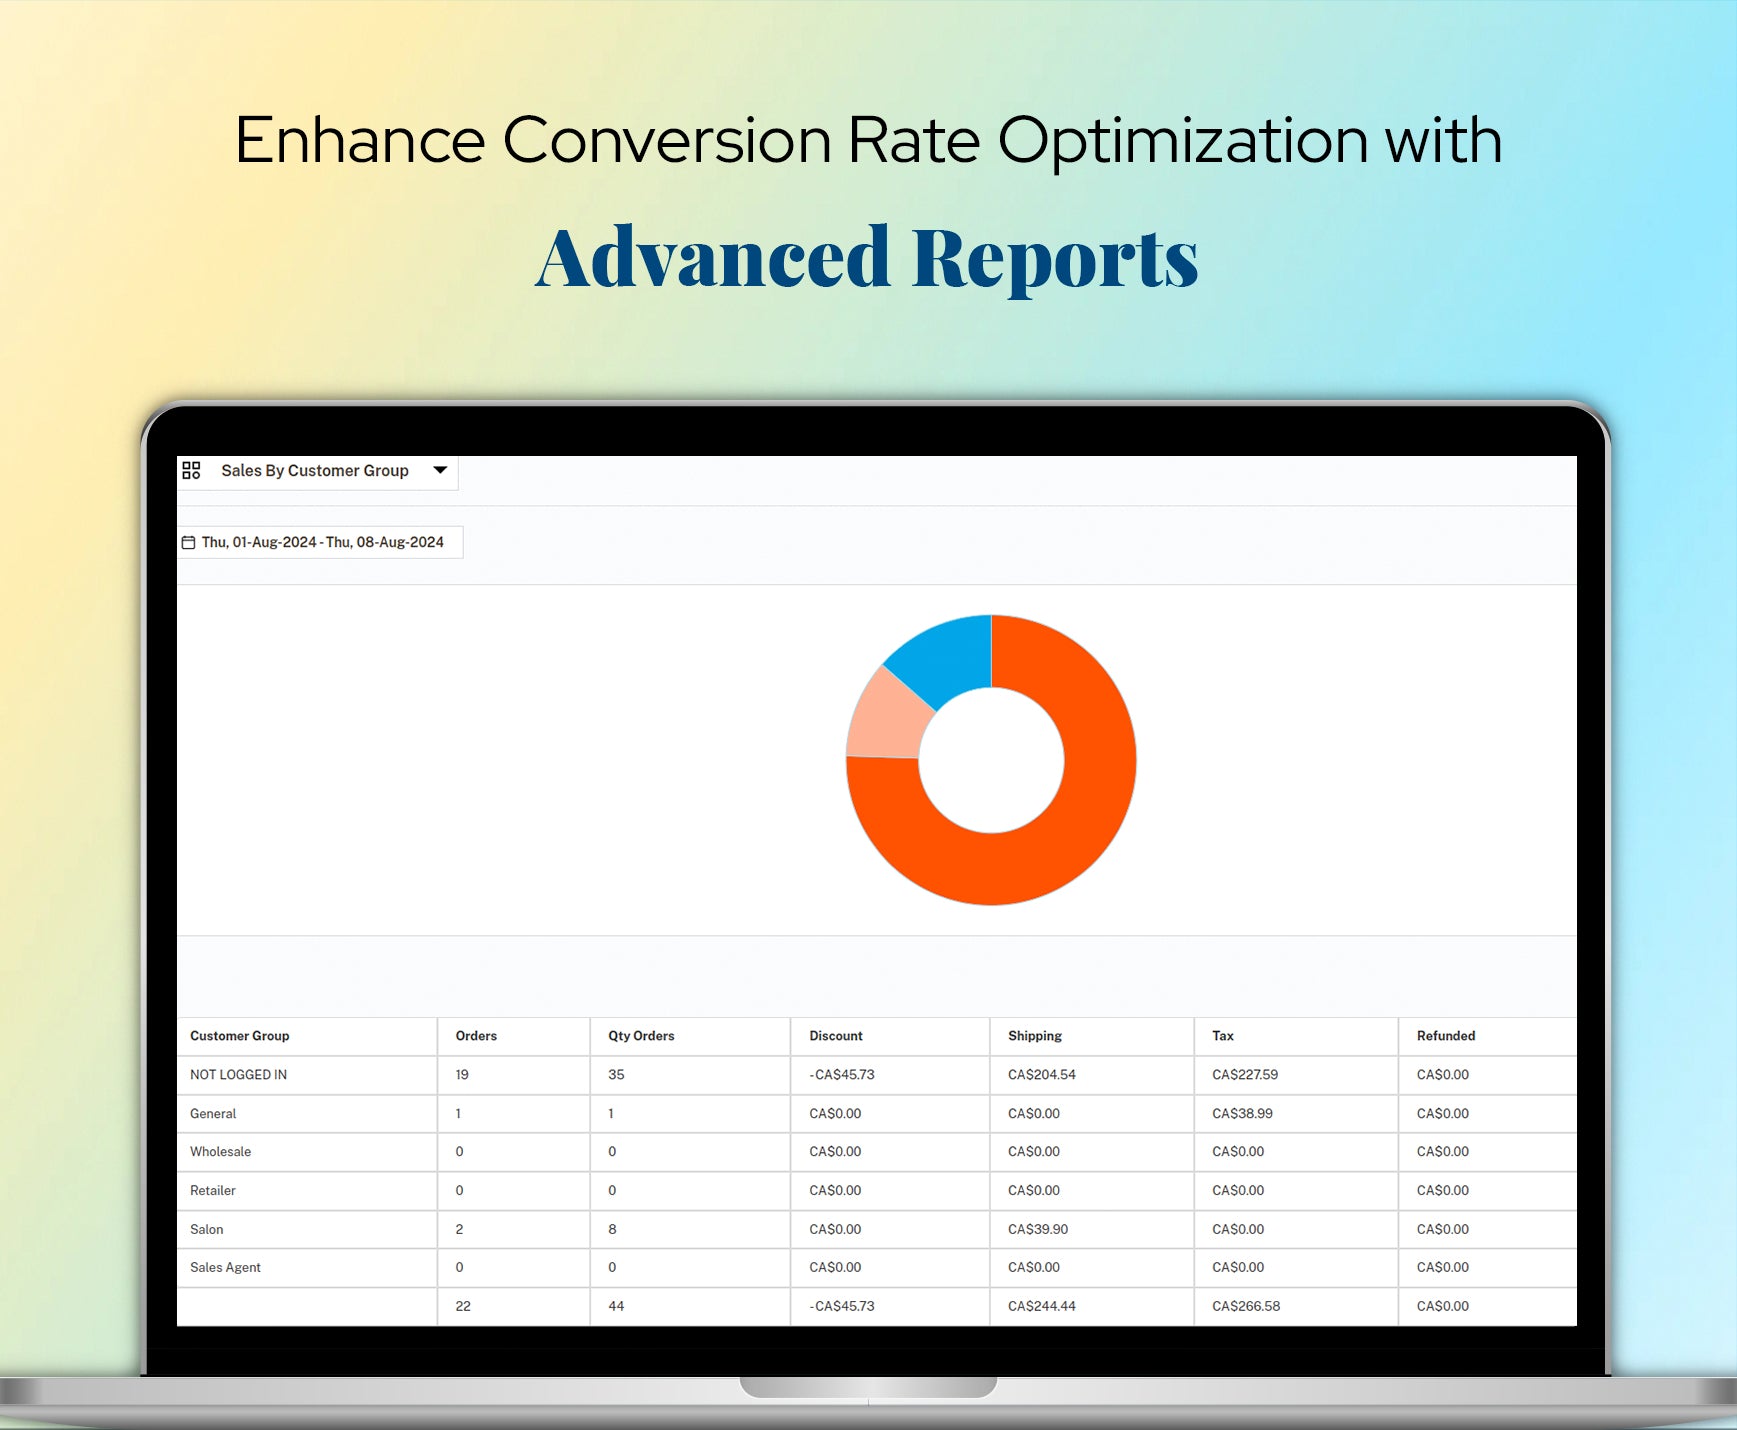
Enhance Conversion Rate Optimization with Advanced Reports
Increase your store's conversion rates with insights from Magento 2 Advanced reports extension. Analyze customer journey data, identify bottlenecks, and optimize the checkout process. Make informed changes to improve the user experience and drive higher conversions.

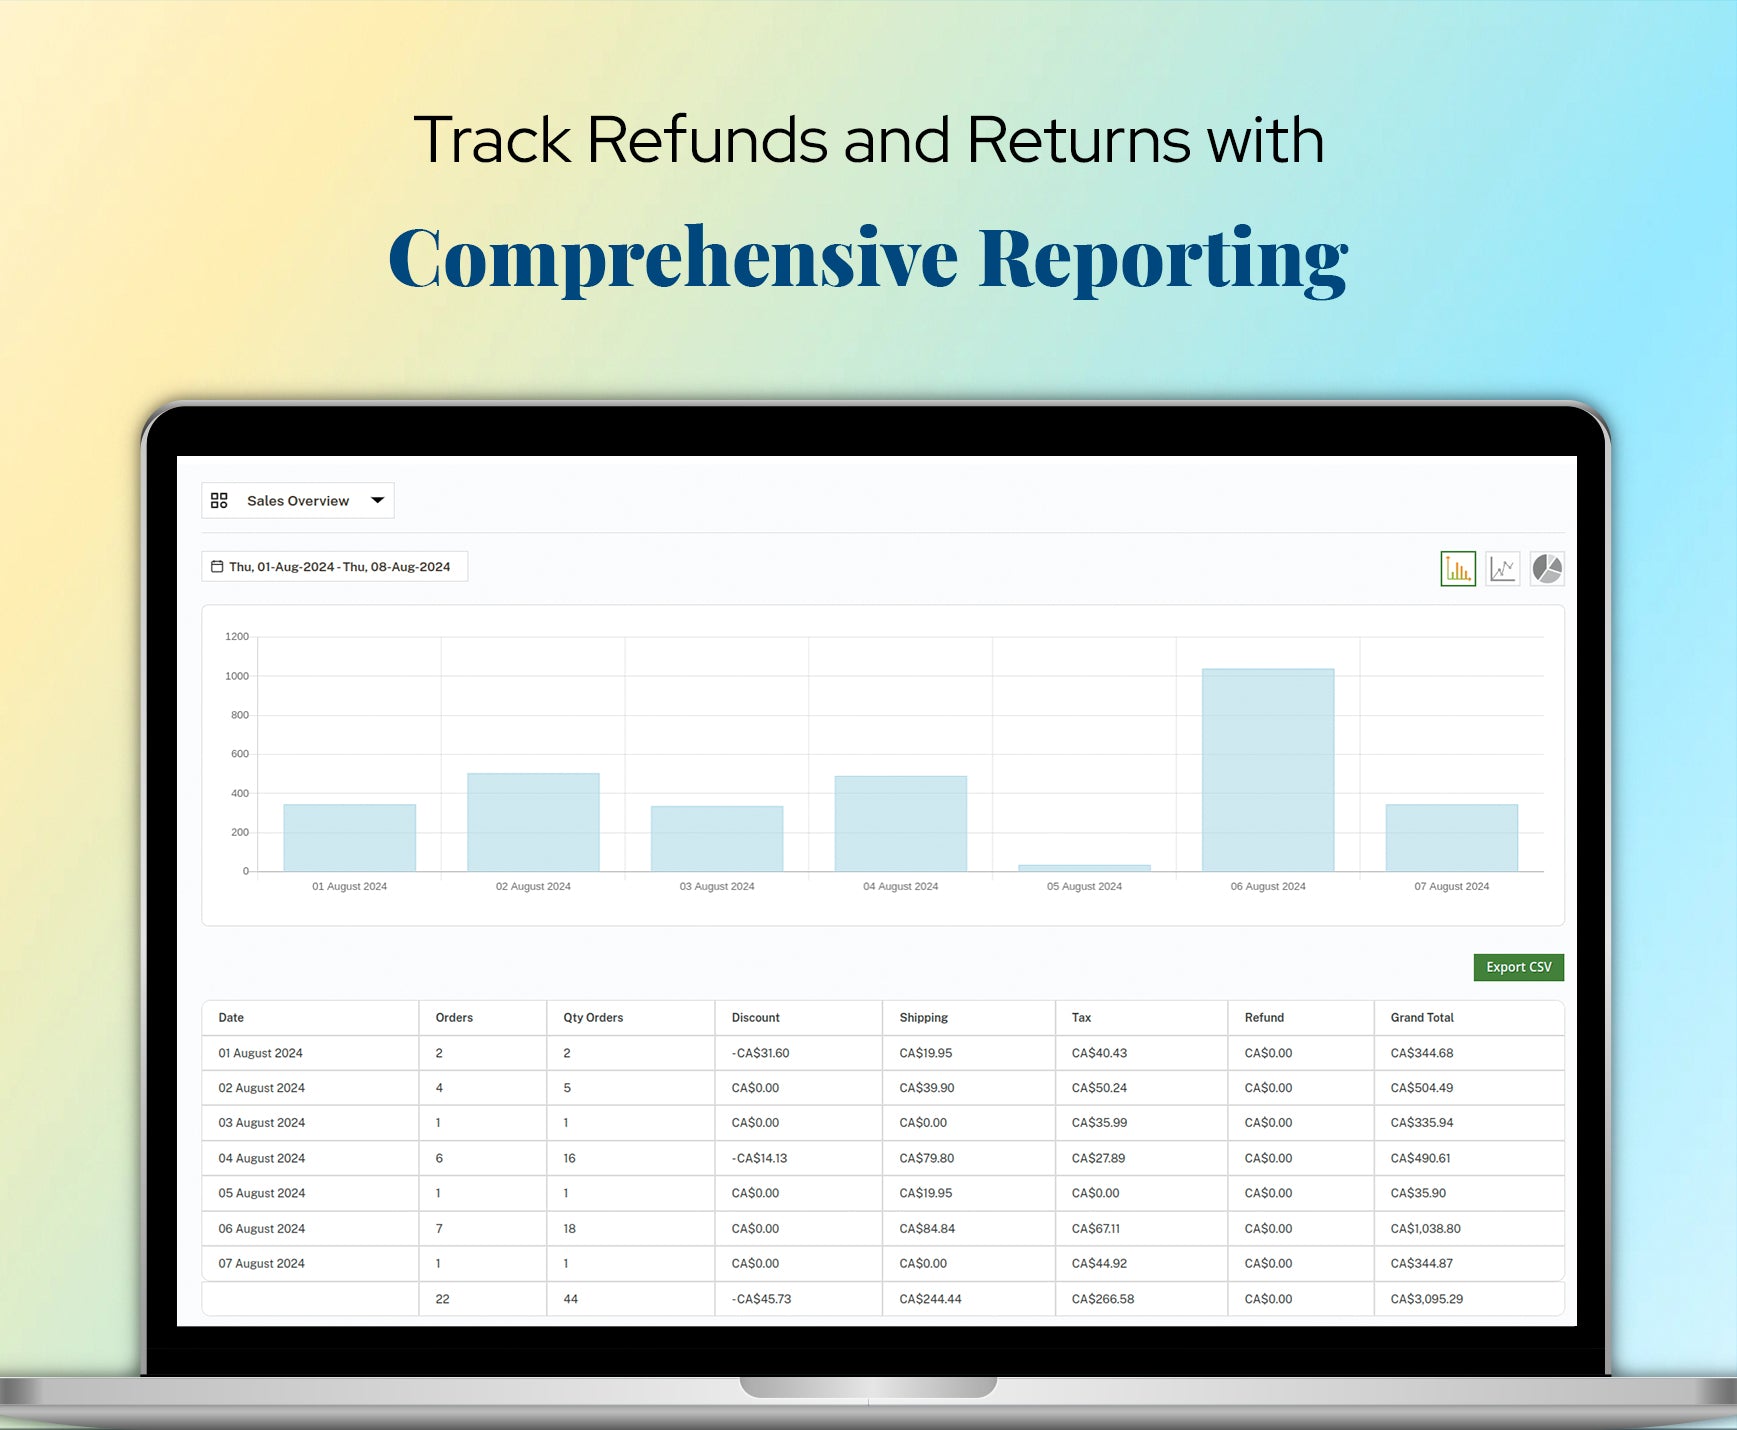
Track Refunds and Returns with Comprehensive Reporting
Manage refunds and returns more effectively with detailed reports from Magento Reporting Extension. Monitor return rates, identify common issues, and implement strategies to reduce returns. Use these insights to improve customer satisfaction and protect your revenue.
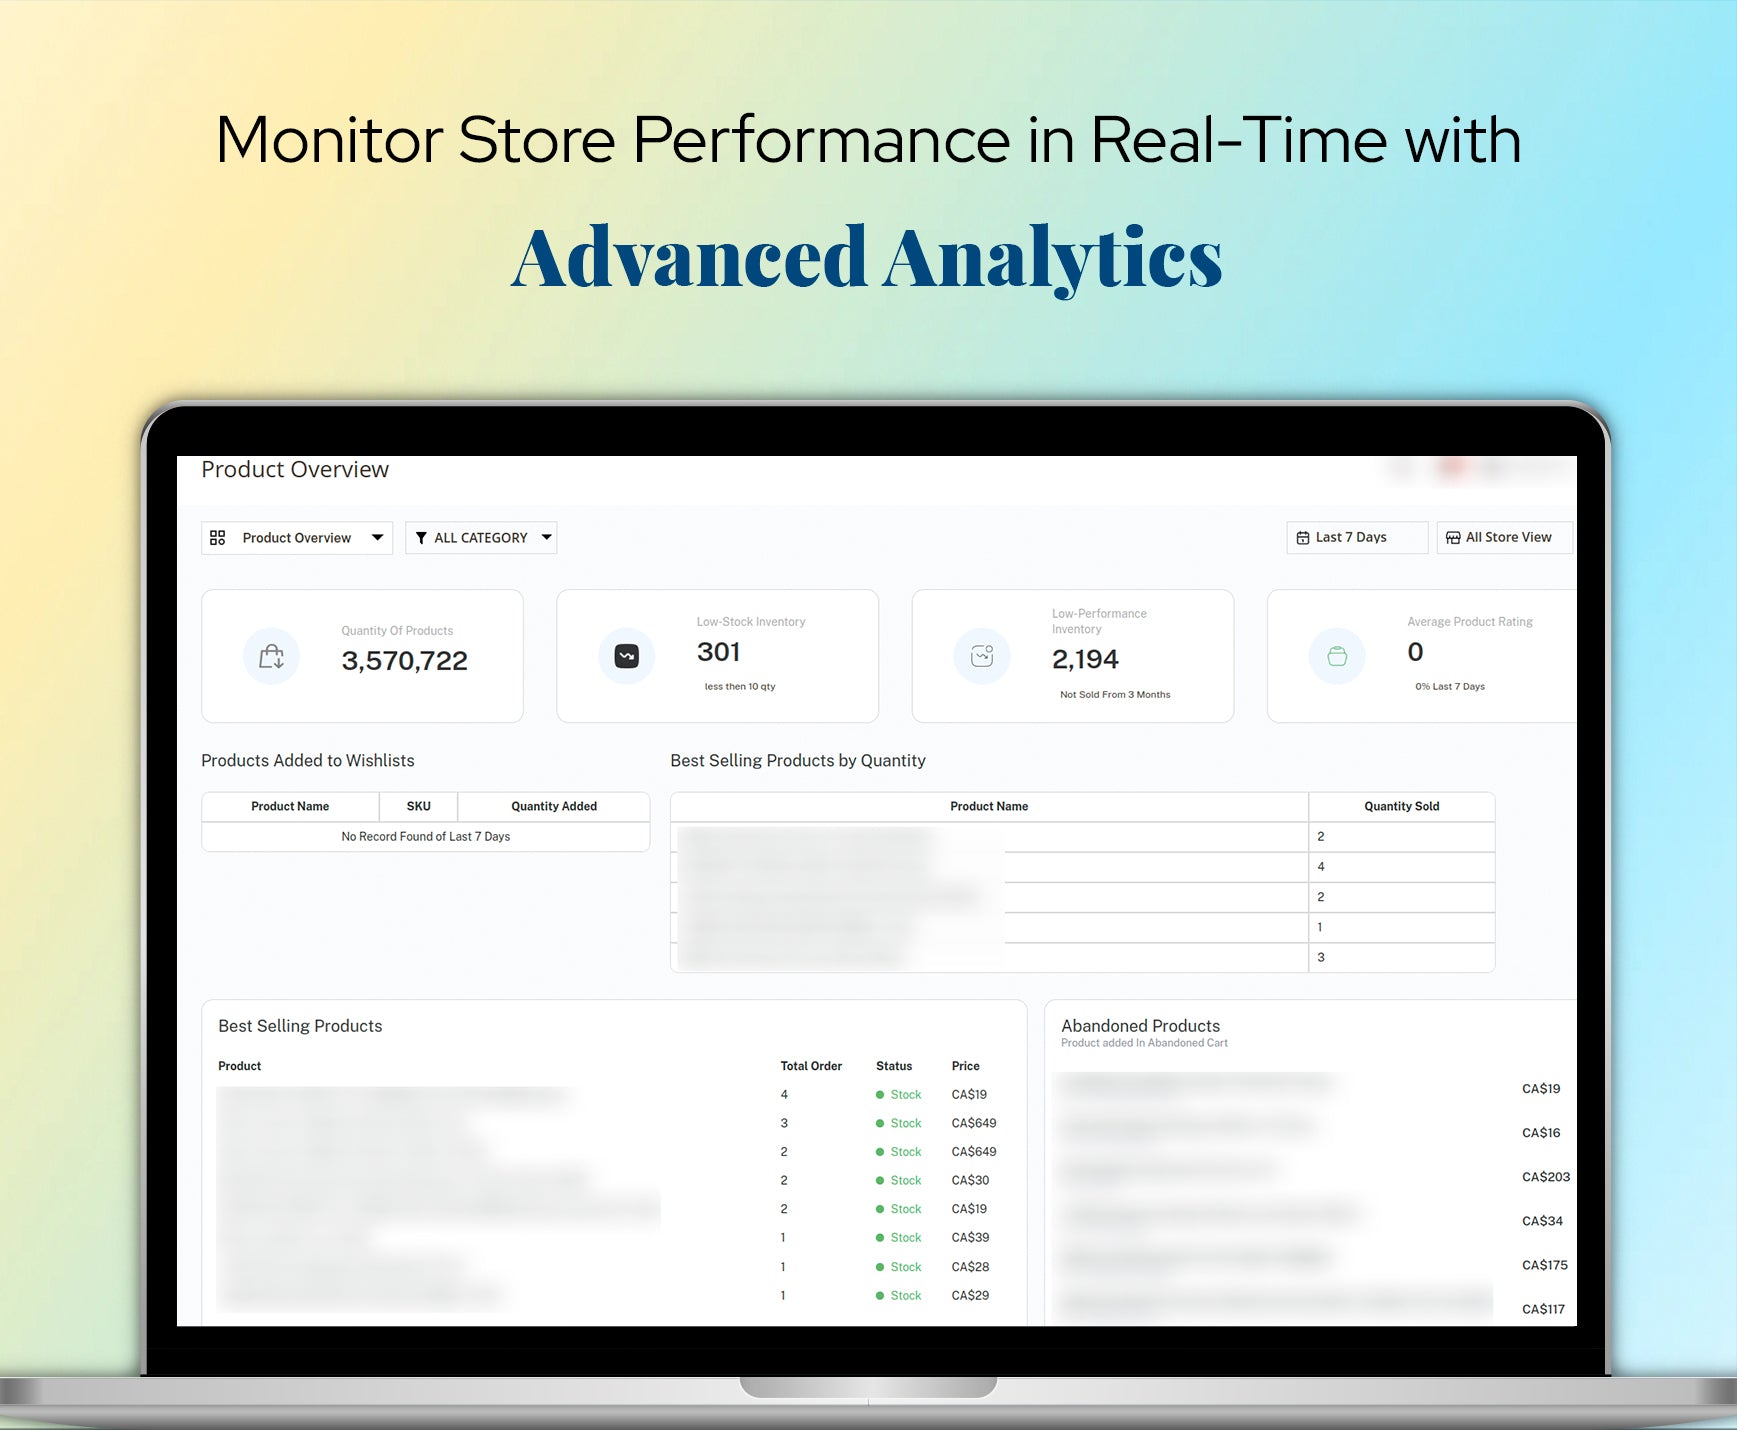
Monitor Store Performance in Real-Time with Advanced Analytics
Stay ahead of the competition by monitoring your store's performance in real-time with Advanced Reports For Magento. Access up-to-date metrics, track key performance indicators (KPIs), and respond quickly to changing market conditions. Keep your business agile and competitive with real-time insights.
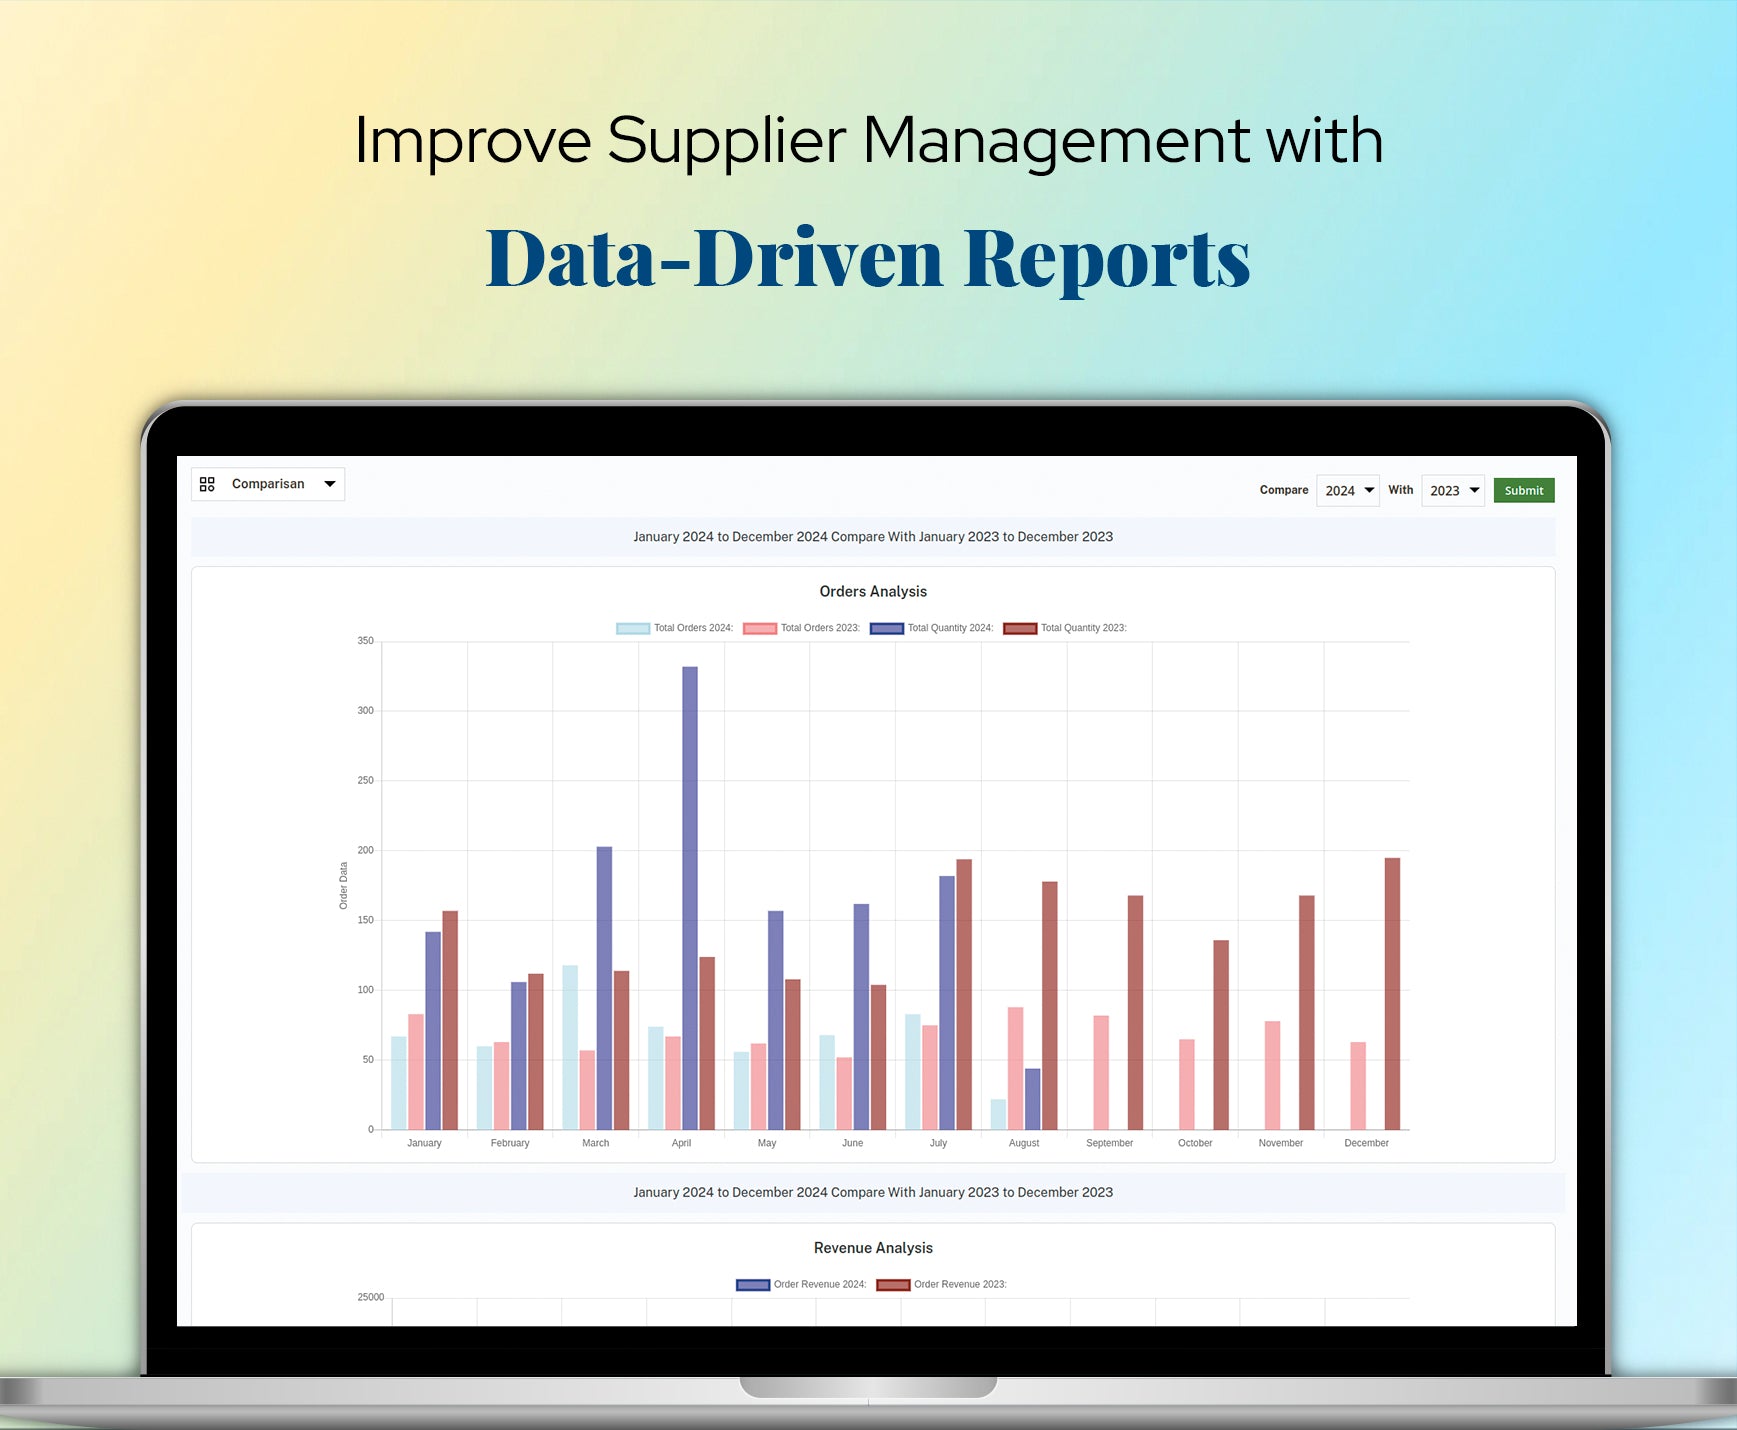
Improve Supplier Management with Data-Driven Reports
Enhance your supplier relationships with insights from Advanced Reporting Magento 2. Analyze supplier performance, track order fulfillment, and optimize your supply chain. Use data-driven decisions to negotiate better terms, improve supplier reliability, and reduce costs.
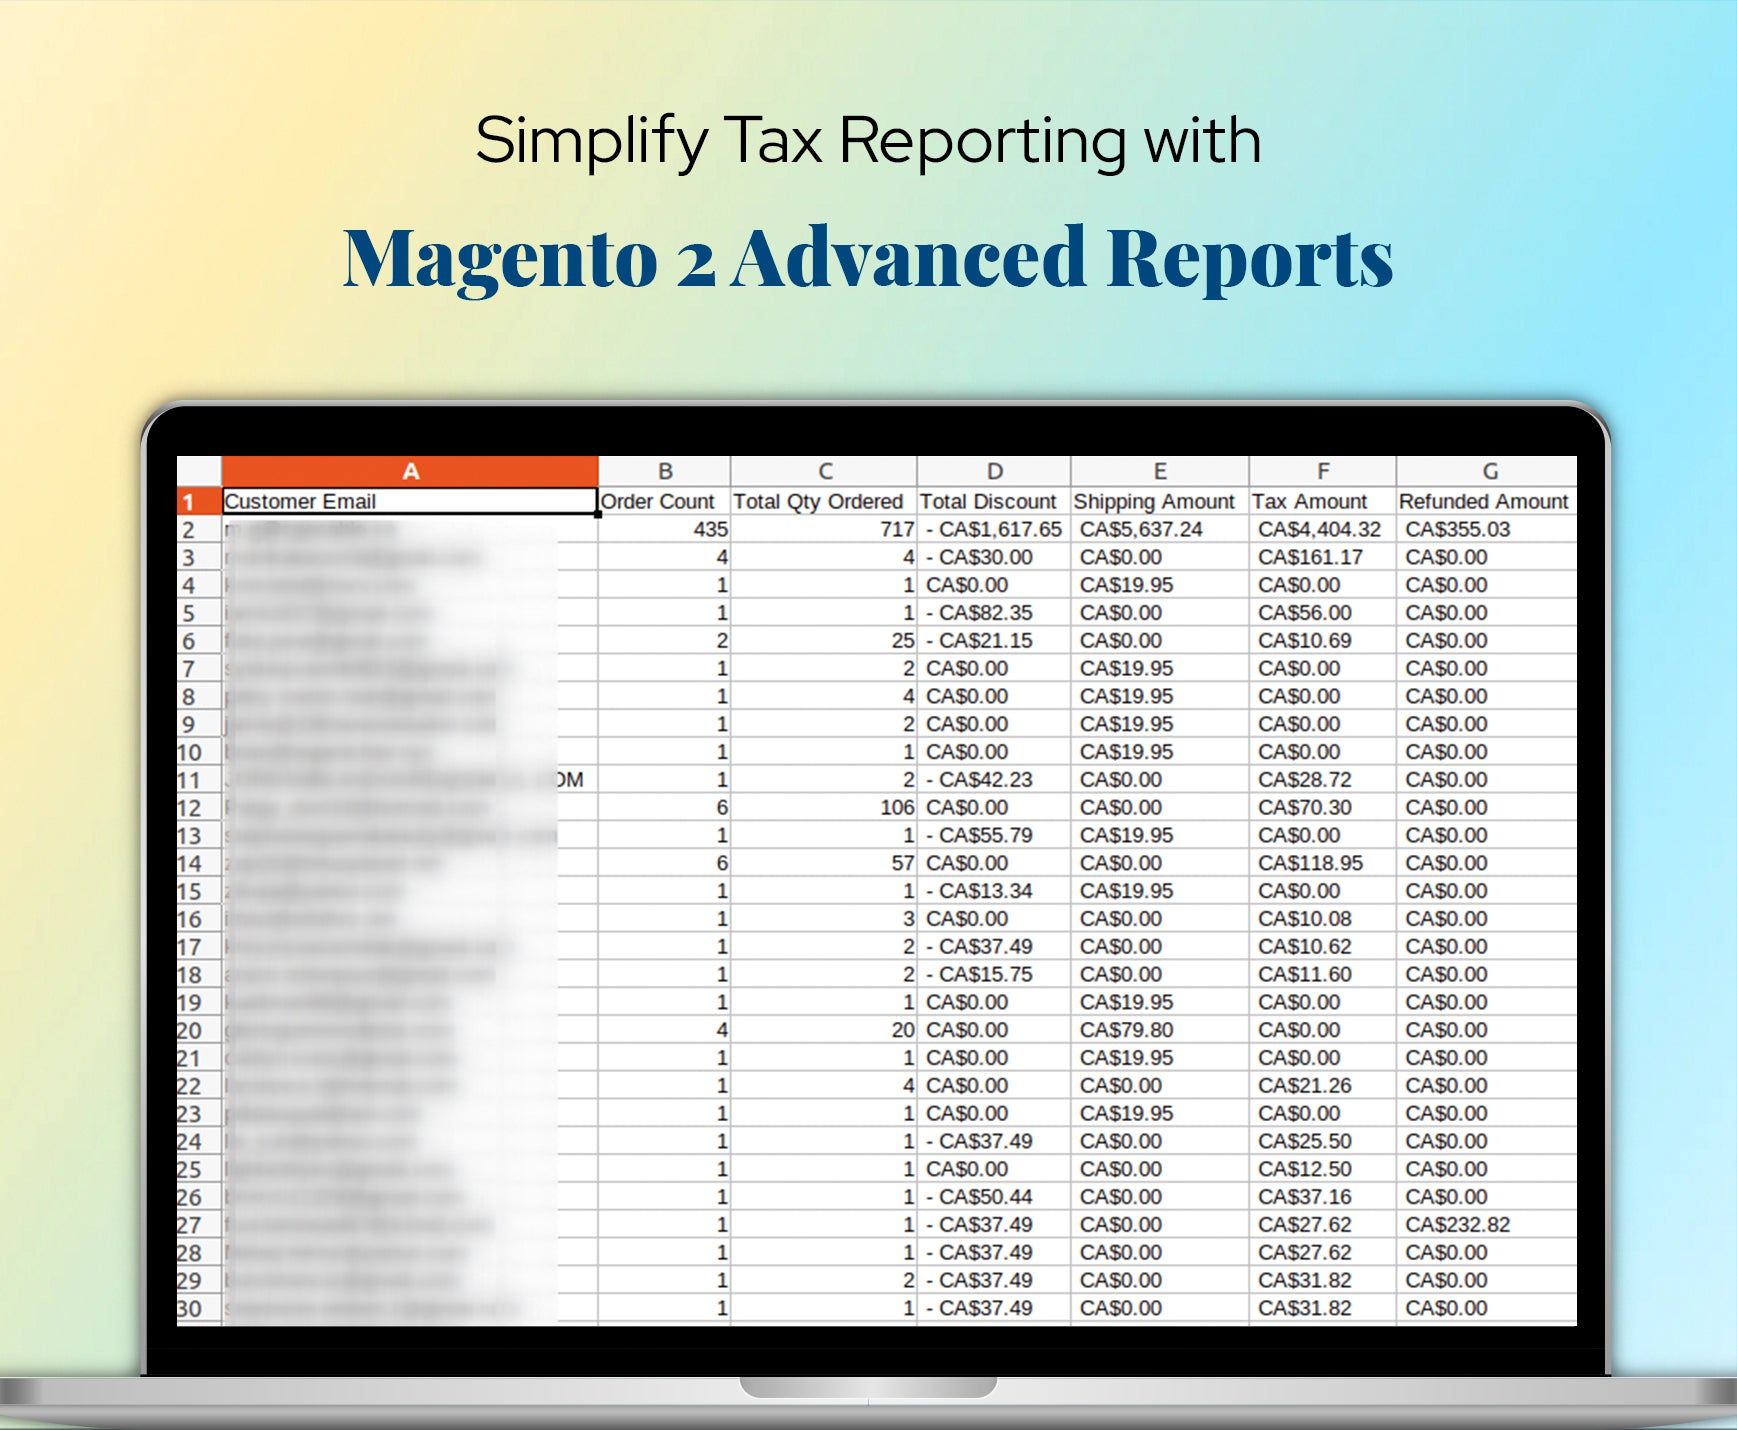
Simplify Tax Reporting with Magento 2 Advanced Reports
Streamline your tax reporting process with Magento 2 Advanced Reports Extension. Access accurate tax data, generate detailed tax reports, and ensure compliance with tax regulations. Save time and reduce errors with automated tax reporting features.

Technical Features of Magento 2 Advanced Reports Extension
- Sales overview reports (daily, monthly, yearly)
- Product performance analysis with SKU-level data
- Customer overview reports (new vs returning customers)
- Order status and revenue tracking
- Filter and sort reports by custom date ranges
- Interactive charts and graphs for easy understanding
- CSV and Excel export support
- Lightweight, fast-loading dashboard integrated into Magento 2
- User-friendly interface for store admins
- Compatible with the latest Magento 2 versions
- Go to Elsner > Schedule Advance Report.
- Click on “Add new row” to create a new report schedule.
- Enter the report title, email subject, recipient email address, and set the report duration (e.g., daily, weekly).
- Set Status to Enable and save the configuration.
- Sales performance reports (daily sales figures, revenue, order numbers).
- Order status updates (new orders, processing, completed transactions).
- Customer activity reports (new registrations, reviews).
- Inventory status (stock levels, low inventory alerts).
- Website traffic reports (visitor numbers, page views).
What Features your Extension Lacks?
Details
Our Advanced Reports Magento 2 extension allows you to make complete use of your store's data. With comprehensive reporting, interactive dashboards, and real-time analytics, you can gain valuable insights into your customers, sales, and inventory. Make data-driven decisions, optimize your marketing strategies, and improve overall store performance. Our Magento 2 Advanced Reports extension is easy to install and use, providing you with the tools you need to succeed in today's competitive e-commerce landscape. This Magento 2 reporting extension ensures you have accurate, actionable insights at your fingertips.
Get Sales Insights with Magento 2 Advanced Reports
Gain a deeper understanding of your store's sales performance with our Advanced Reports for Magento 2 extension. Analyze sales trends, identify top-selling products, and discover opportunities to maximize revenue. With real-time data and customizable reports, you can make informed decisions to boost your sales and drive growth.
Optimize Inventory Management with Advanced Reporting
Prevent stockouts and reduce overstocking with the Advanced Reports For Magento 2 extension. Access detailed inventory reports that help you track stock levels, understand product demand, and optimize your inventory management. Make data-driven decisions to maintain the right stock levels and improve your store's efficiency Magento 2 Reporting Extension..
Understand Customer Behavior with Magento 2 Advanced Reports
Get to know your customers better with comprehensive customer behavior analysis. Our Magento 2 Advanced reports extension allows you to track customer purchasing habits, segment your audience, and personalize your marketing efforts. Use these insights to build stronger customer relationships and increase loyalty.
Measure Marketing Campaign Success with Data-Driven Reports
Evaluate the effectiveness of your marketing campaigns with precise data from Magento 2 Advanced reports extension. Track campaign performance, measure ROI, and identify areas for improvement. Leverage these insights to refine your marketing strategies and achieve better results.
Enhance Product Performance Analysis with Advanced Reporting
Discover which products drive the most revenue with Advanced Reports Magento 2. Analyze product performance, identify best-sellers, and spot trends to optimize your product offerings. Use this data to make strategic decisions that boost your store's profitability.
Streamline Financial Reporting with Magento 2 Advanced Reports
Simplify your financial reporting with the powerful tools provided by Magento 2 Reporting Extension. Access detailed financial reports, track revenue, monitor expenses, and ensure accurate financial management. Save time and improve accuracy with automated reporting features.
Optimize Shipping and Fulfillment with Advanced Analytics
Improve your shipping and fulfillment processes with actionable insights from Magento 2 Reports extension. Track order fulfillment rates, shipping costs, and delivery times to enhance customer satisfaction and reduce operational costs. Use this data to streamline your logistics and boost efficiency.
Boost Customer Retention with Data-Driven Insights
Retain more customers by understanding their needs and preferences with Magento Reporting Extensions. Analyze customer retention metrics, identify at-risk customers, and implement targeted strategies to keep them engaged. Strengthen customer loyalty and drive repeat business with data-backed decisions.
Enhance Conversion Rate Optimization with Advanced Reports
Increase your store's conversion rates with insights from Magento 2 Advanced reports extension. Analyze customer journey data, identify bottlenecks, and optimize the checkout process. Make informed changes to improve the user experience and drive higher conversions.
Track Refunds and Returns with Comprehensive Reporting
Manage refunds and returns more effectively with detailed reports from Magento Reporting Extension. Monitor return rates, identify common issues, and implement strategies to reduce returns. Use these insights to improve customer satisfaction and protect your revenue.
Monitor Store Performance in Real-Time with Advanced Analytics
Stay ahead of the competition by monitoring your store's performance in real-time with Advanced Reports For Magento. Access up-to-date metrics, track key performance indicators (KPIs), and respond quickly to changing market conditions. Keep your business agile and competitive with real-time insights.
Improve Supplier Management with Data-Driven Reports
Enhance your supplier relationships with insights from Advanced Reporting Magento 2. Analyze supplier performance, track order fulfillment, and optimize your supply chain. Use data-driven decisions to negotiate better terms, improve supplier reliability, and reduce costs.
Simplify Tax Reporting with Magento 2 Advanced Reports
Streamline your tax reporting process with Magento 2 Advanced Reports Extension. Access accurate tax data, generate detailed tax reports, and ensure compliance with tax regulations. Save time and reduce errors with automated tax reporting features.
Features
Technical Features of Magento 2 Advanced Reports Extension
- Sales overview reports (daily, monthly, yearly)
- Product performance analysis with SKU-level data
- Customer overview reports (new vs returning customers)
- Order status and revenue tracking
- Filter and sort reports by custom date ranges
- Interactive charts and graphs for easy understanding
- CSV and Excel export support
- Lightweight, fast-loading dashboard integrated into Magento 2
- User-friendly interface for store admins
- Compatible with the latest Magento 2 versions
FAQs
What types of reports can I generate with the Advanced Reports Magento 2 extension?
You can generate a variety of customizable reports, including sales, customer behavior, product performance, inventory management, financial metrics, and marketing campaign analysis with Magento Advanced Reports.
Is the Advanced Reports extension compatible with the latest version of Magento 2?
Yes, the Advanced Reports extension for Magento 2 is fully compatible with the latest version of Magento 2 and is regularly updated to ensure compatibility with future releases.
How does the extension help with inventory management?
The Magento 2 reports extension provides detailed inventory reports that allow you to track stock levels, understand product demand, and prevent stock outs or overstocking. This helps optimize inventory management and improves store efficiency.
Can I export reports to other formats like CSV or Excel?
Yes, the Advanced Reports extension allows you to export your reports to CSV, Excel, or PDF formats for further analysis or sharing with your team.
Does the extension offer real-time analytics?
Absolutely, the Advanced Report extension for Magento 2 extension provides real-time analytics, enabling you to monitor key performance metrics and make data-driven decisions quickly to respond to changing business conditions.
Is the Advanced Reports Magento 2 extension easy to install and use?
Yes, the Magento 2 Advanced Reports extension is designed for easy installation and use. It comes with user-friendly dashboards and customizable reports, making it accessible even for those without advanced technical skills.
How can I access the reports generated by the extension?
You can access the Magento Reporting Extension from the admin panel by navigating to Elsner > Advance Dashboard. From there, you can choose from options like Sales Overview, Customer Overview, and Product Overview. Each category provides detailed insights into various metrics, such as orders, revenue, customer behavior, and inventory status.
Does the Advanced Reports Magento 2 extension handle multiple stores and currencies?
Yes, our Magento 2 Advanced Reports Extension supports multi-store environments, allowing you to view and analyze data for each store separately. However, please note that the extension currently only supports stores that use a single currency.
Is my data secure with the Advanced Reporting Extension?
Yes, your data is kept secure with our Magento 2 Advanced Reports Extension. The extension is designed with privacy and data security in mind, ensuring that your business data is protected at all times.
What kind of customer support is available if I encounter issues?
Elsner Technologies offers comprehensive customer support, including documentation, tutorials, and direct support via email or chat. You can also access regular updates to ensure the Magento Reporting Extension continues to perform well with new Magento releases.
How can I automate daily report notifications?
To automate daily report notifications, follow these steps:
- Go to Elsner > Schedule Advance Report.
- Click on “Add new row” to create a new report schedule.
- Enter the report title, email subject, recipient email address, and set the report duration (e.g., daily, weekly).
- Set Status to Enable and save the configuration.
What types of reports can I receive through email notifications?
You can receive various types of reports via email, including:
- Sales performance reports (daily sales figures, revenue, order numbers).
- Order status updates (new orders, processing, completed transactions).
- Customer activity reports (new registrations, reviews).
- Inventory status (stock levels, low inventory alerts).
- Website traffic reports (visitor numbers, page views).
Reviews
Features Request
What Features your Extension Lacks?


