


Advance Reporting for Magento 2
 Community: 2.3.x, 2.4.x Enterprise: 2.3.x, 2.4.x

30 Days
Money Back

Highly Secure &
Stable Products

Free 9 Months
Upgrade

Free 90 Days
Support
Price $0.00
Price $0.00

Advance Reporting for Magento 2
Price $0.00
Price $0.00

Screenshots

- Details
- Reviews
- Features Request
Gain a crystal-clear view of your business. Analyze trends, identify opportunities, and make data-driven decisions to improve your bottom line. Explore a comprehensive library of reports covering critical areas like sales, customers, products, marketing campaigns, and inventory. With Magento 2 Advanced Reporting, you'll have the information you need to make informed choices and drive growth for your online store.
Transform complex data into actionable insights. Don't settle for surface-level information. Drill down into reports to uncover hidden patterns and customer behavior. Our extension presents information in visually appealing formats like charts, graphs, and heatmaps, making it easy to understand trends and identify areas for improvement at a glance.
Effortlessly customize your reporting experience. Tailor reports to your specific needs. Set custom time frames, apply filters to focus on relevant data points, and personalize reports to match your unique business objectives. Create custom dashboards that display the most critical KPIs for your business. Gain a real-time snapshot of your store's health and monitor key metrics at your fingertips.
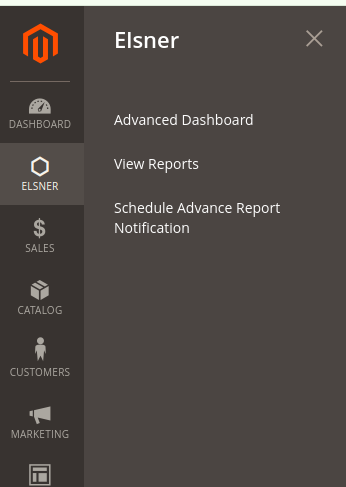
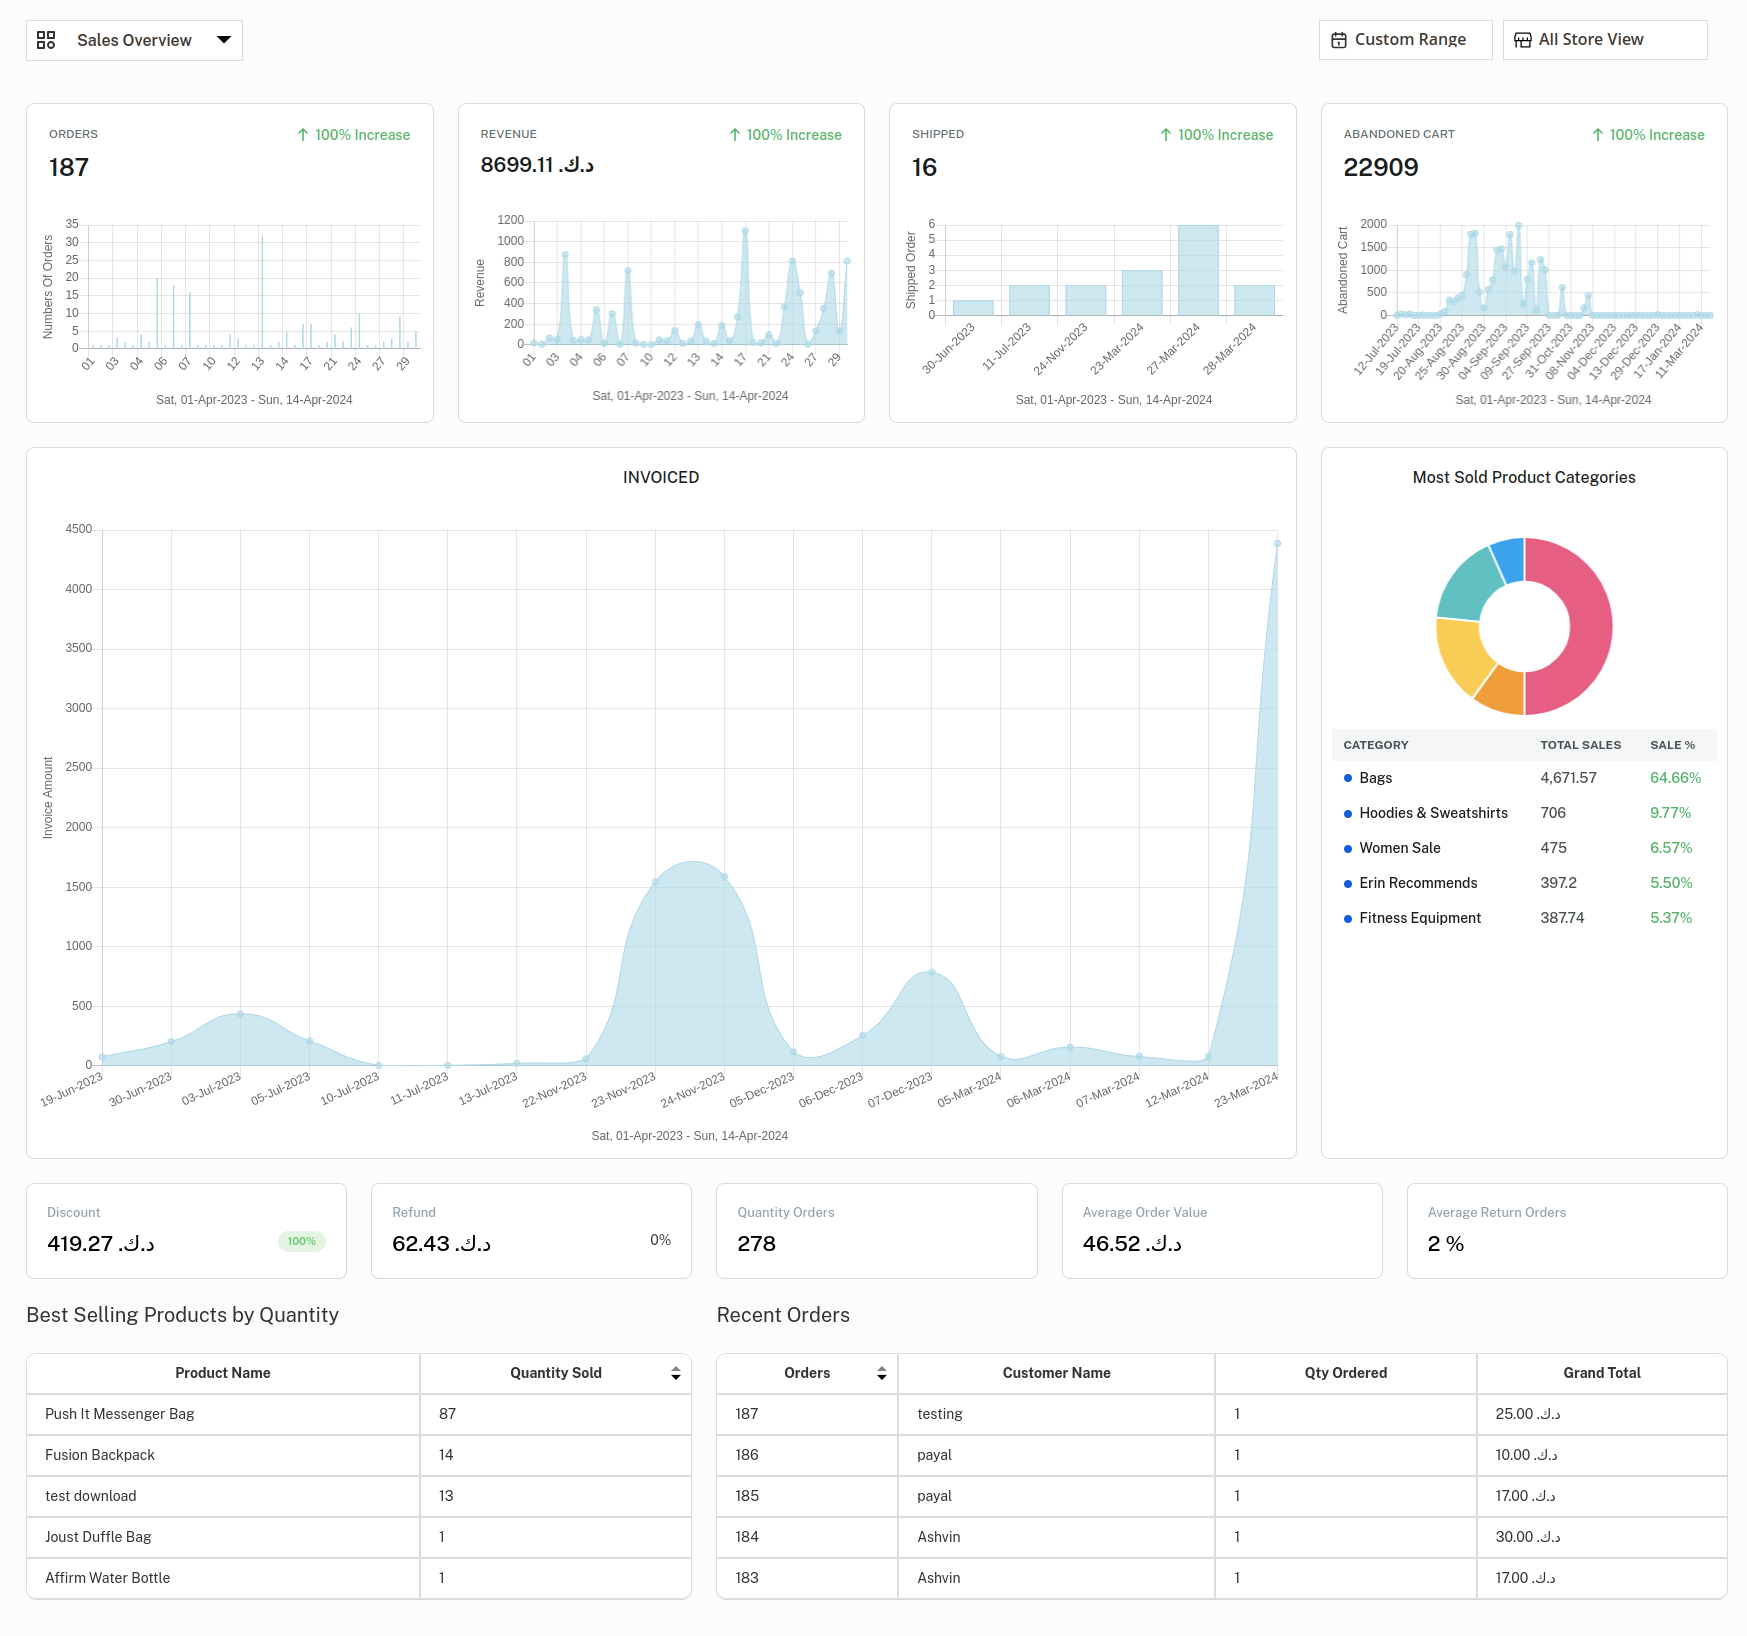
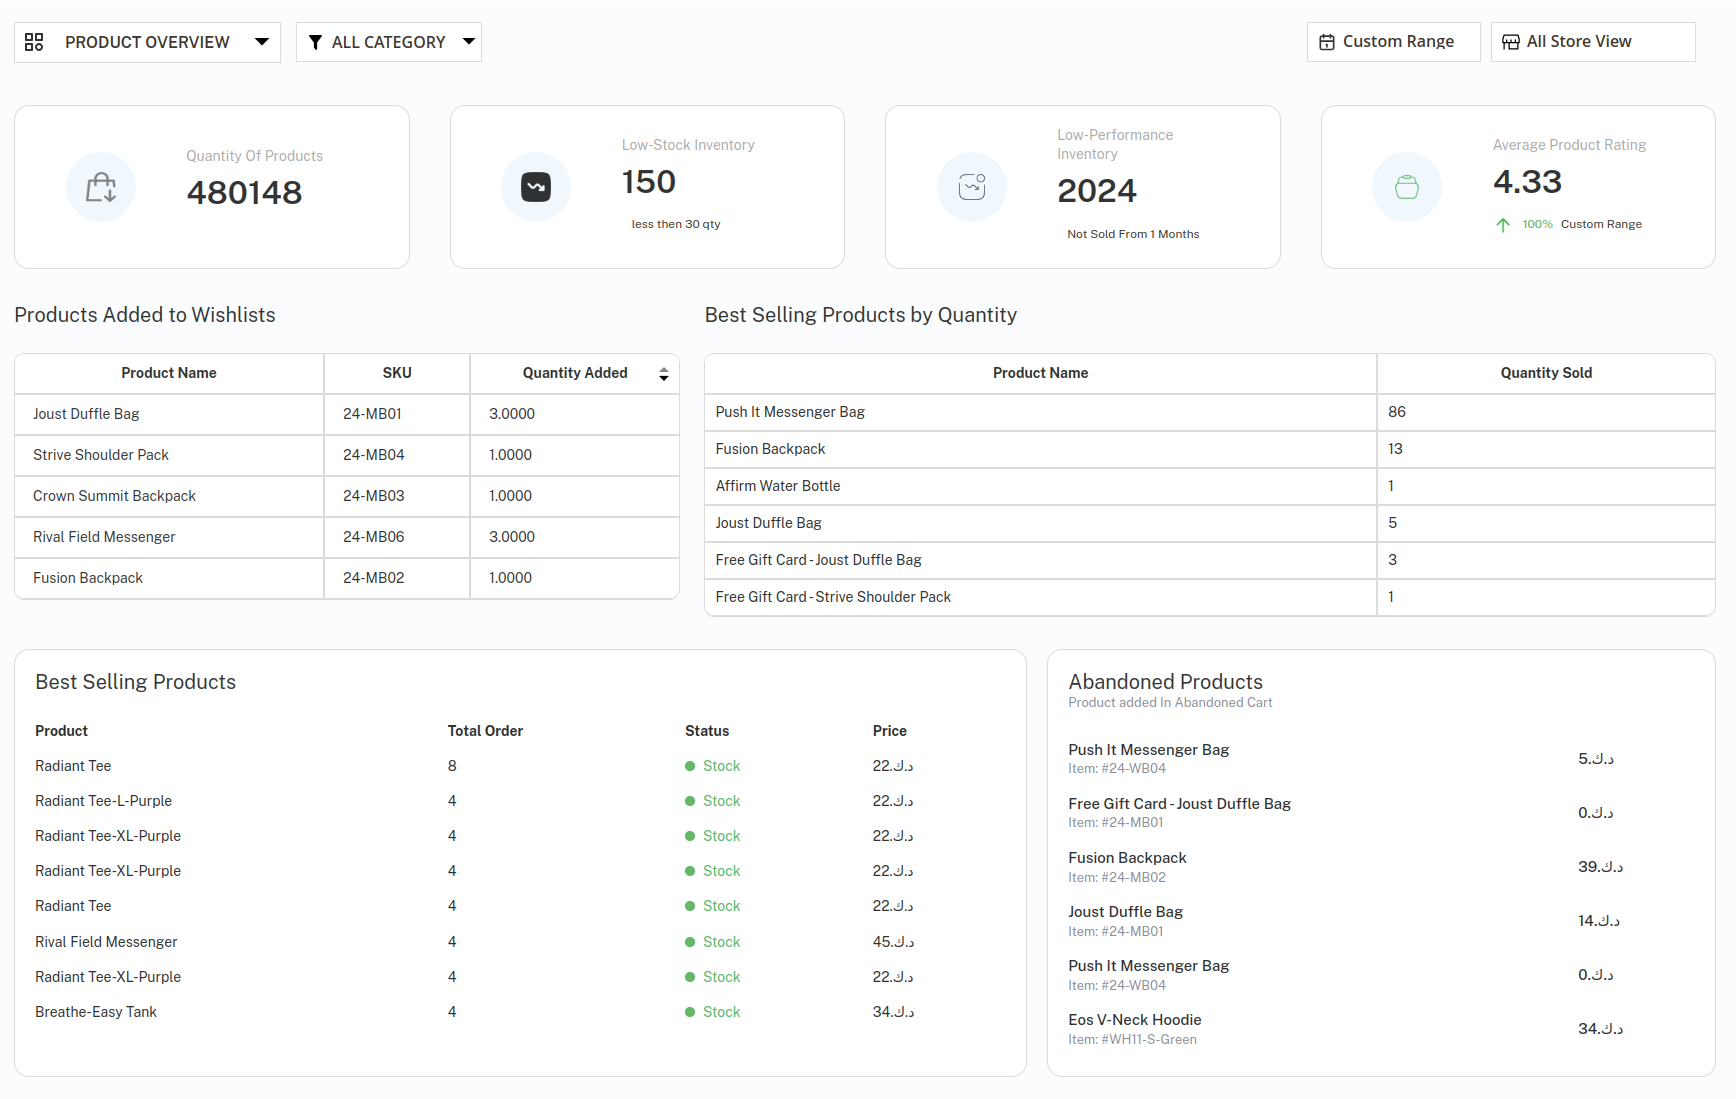
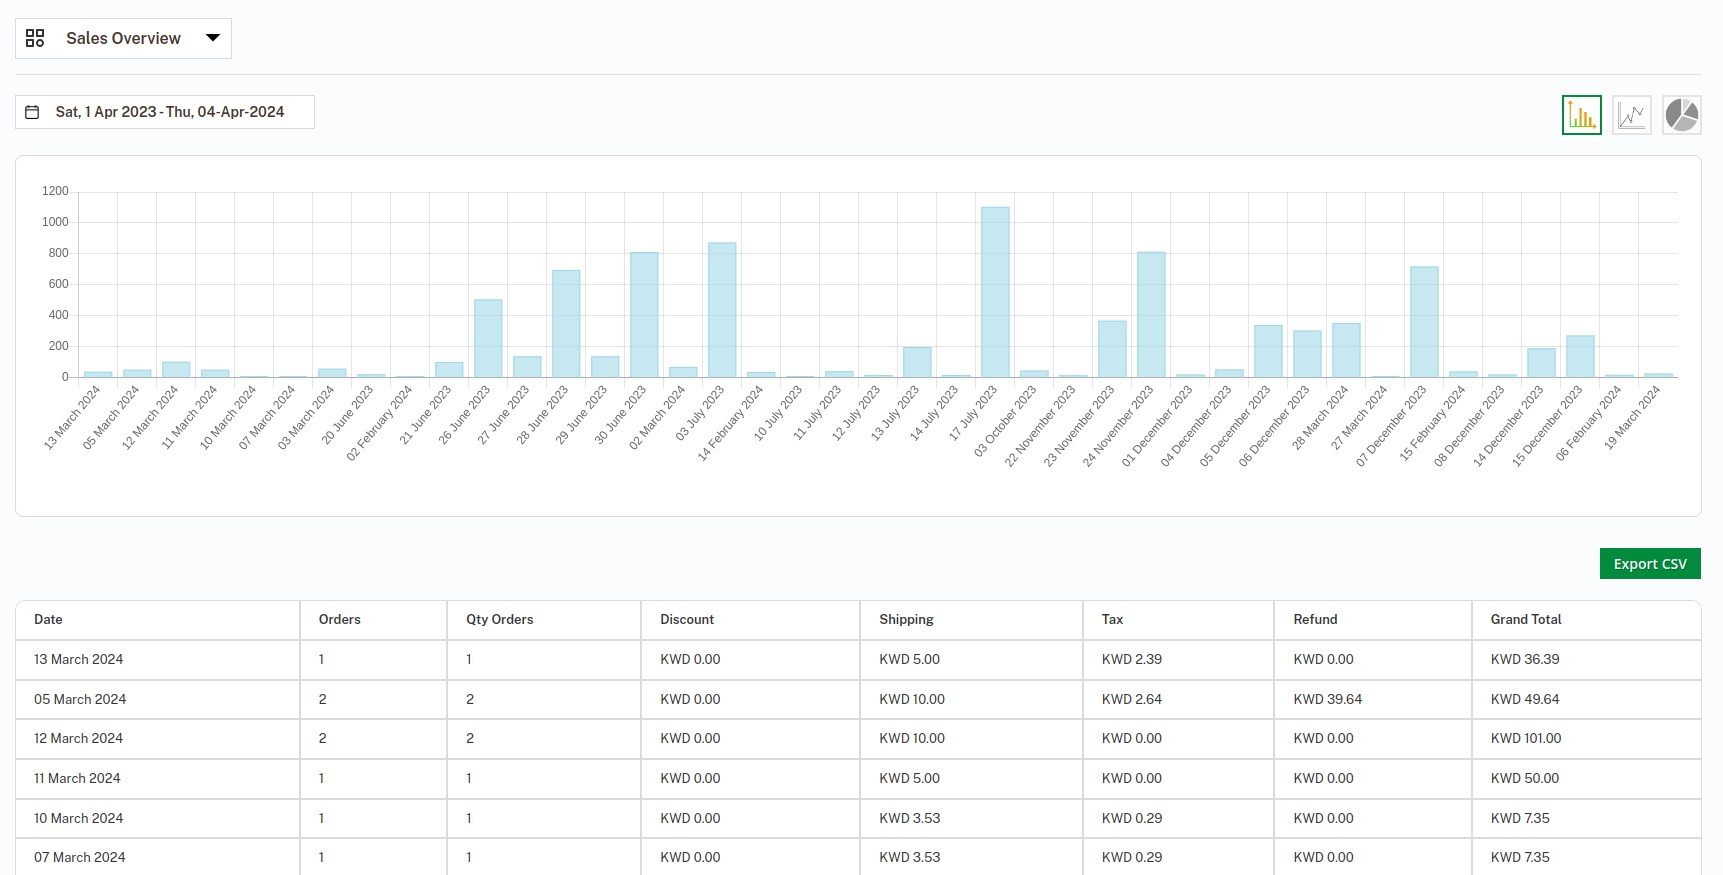
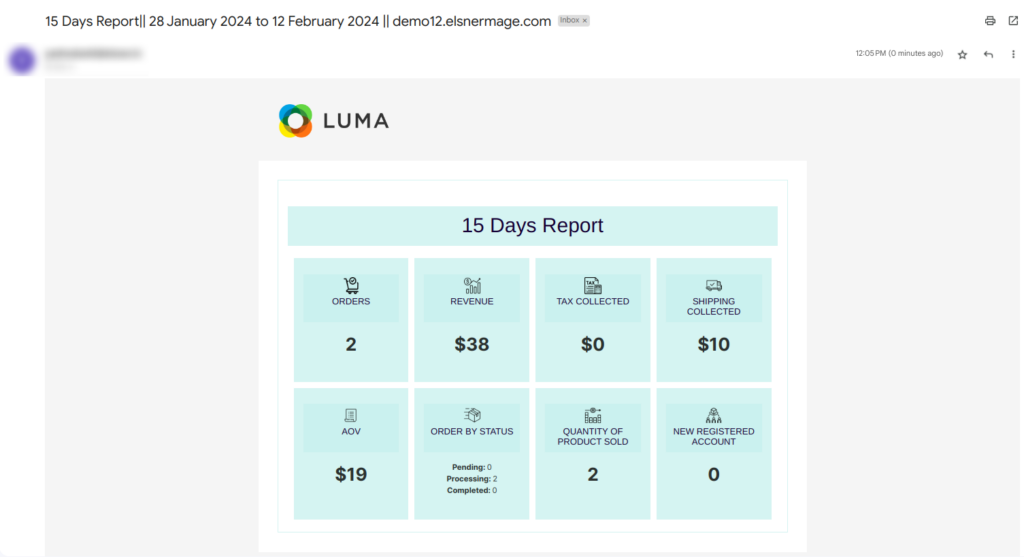
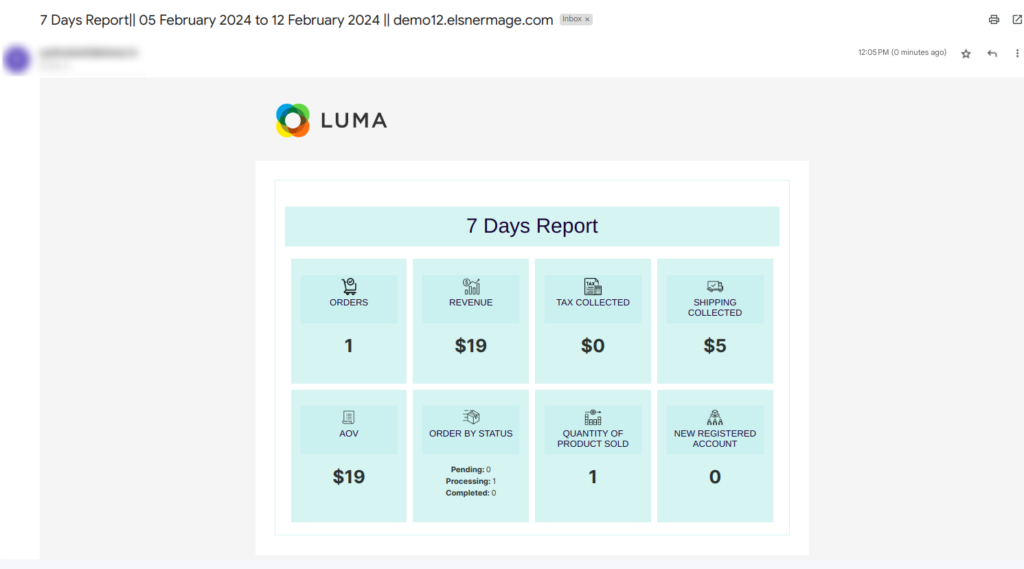
1. Readymade Dashboard-Pre-configured dashboards with essential KPIs (Key Performance Indicators) for sales, marketing, inventory, and customer behavior. This provides a quick and easy overview of your store's performance without needing to build custom reports.
Benefits-Saves time, provides immediate insights, streamlines decision-making.
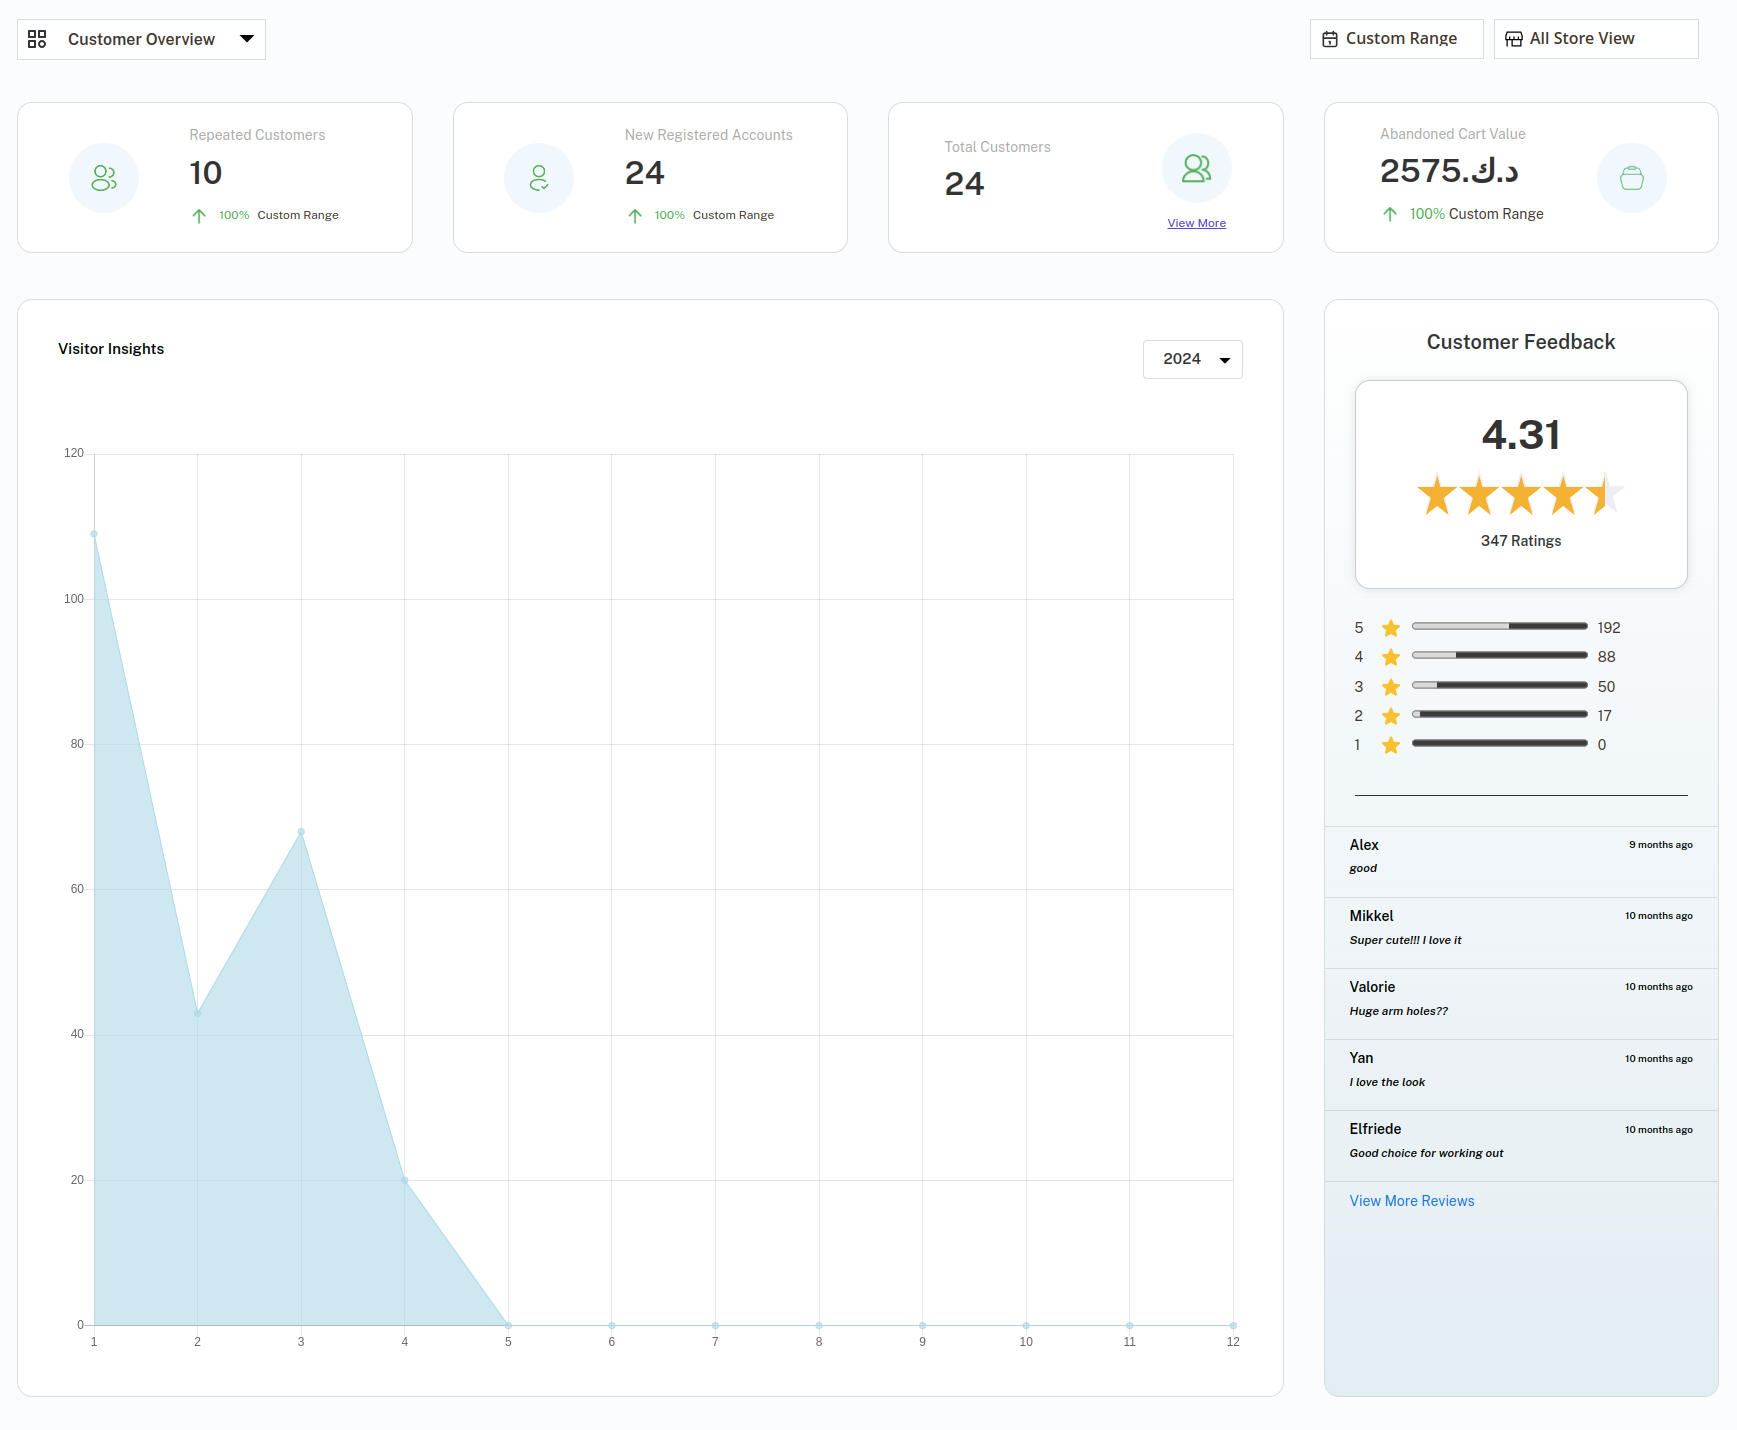
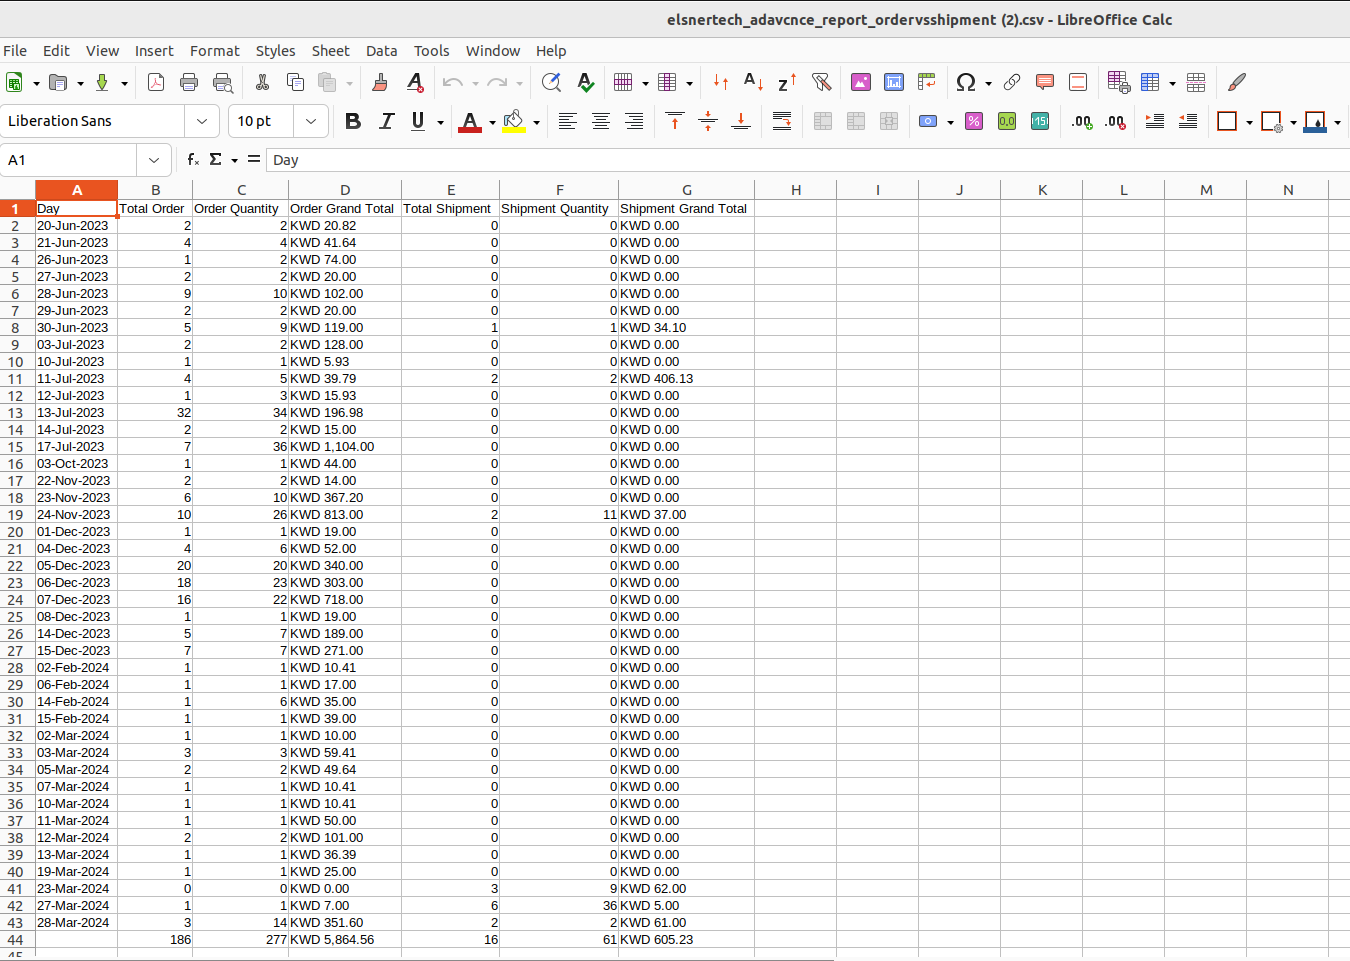
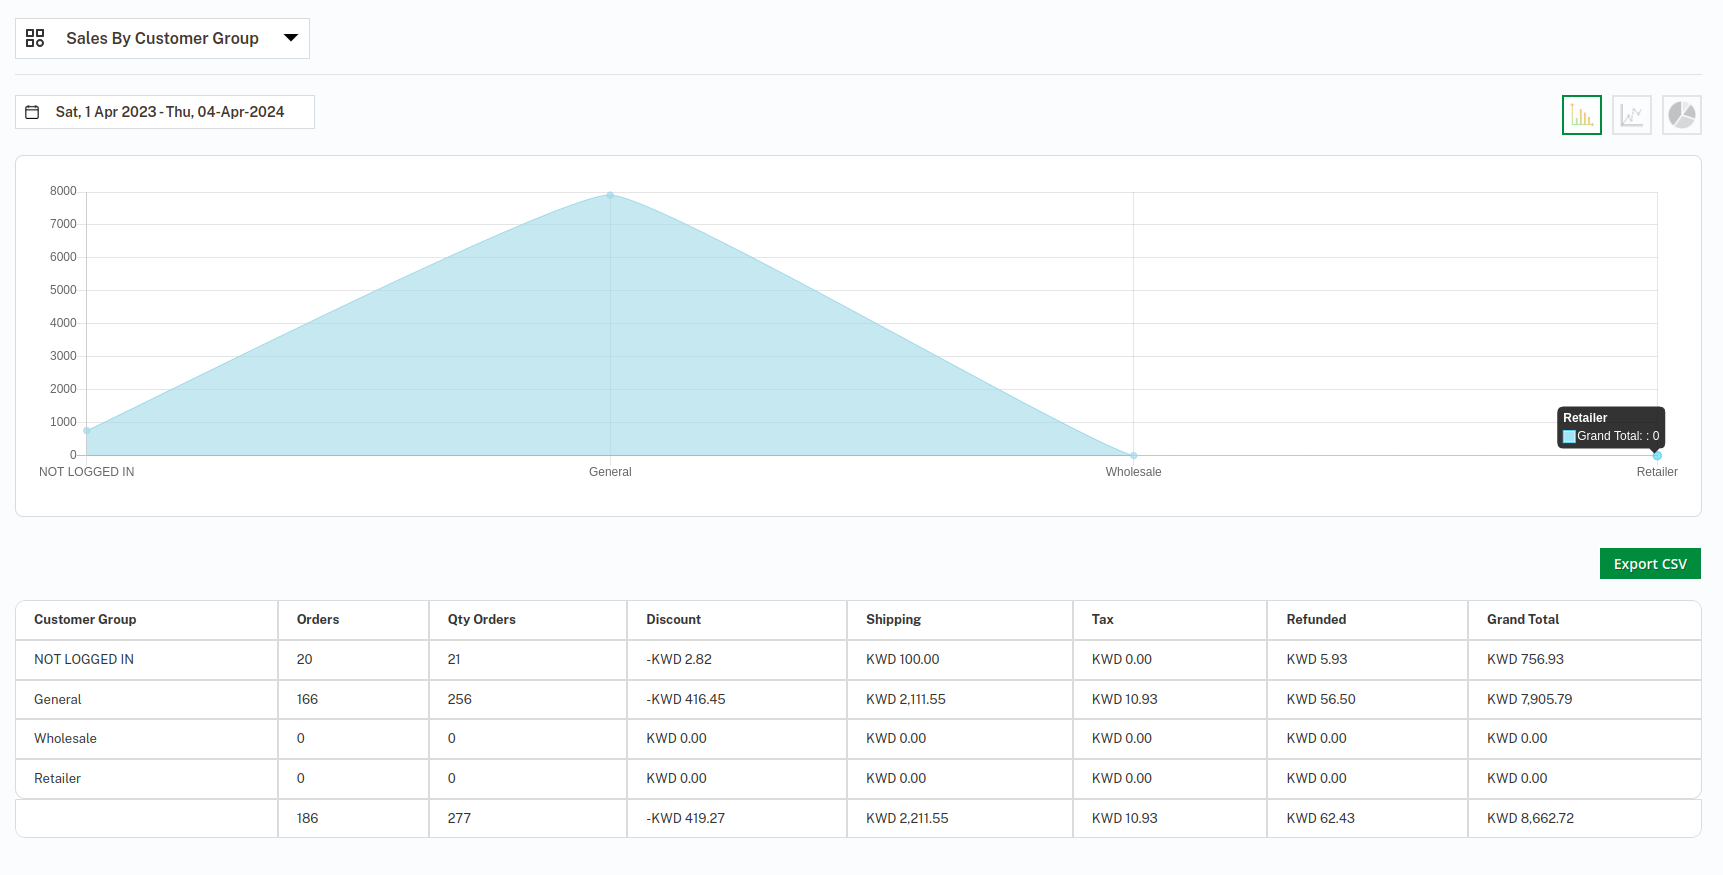
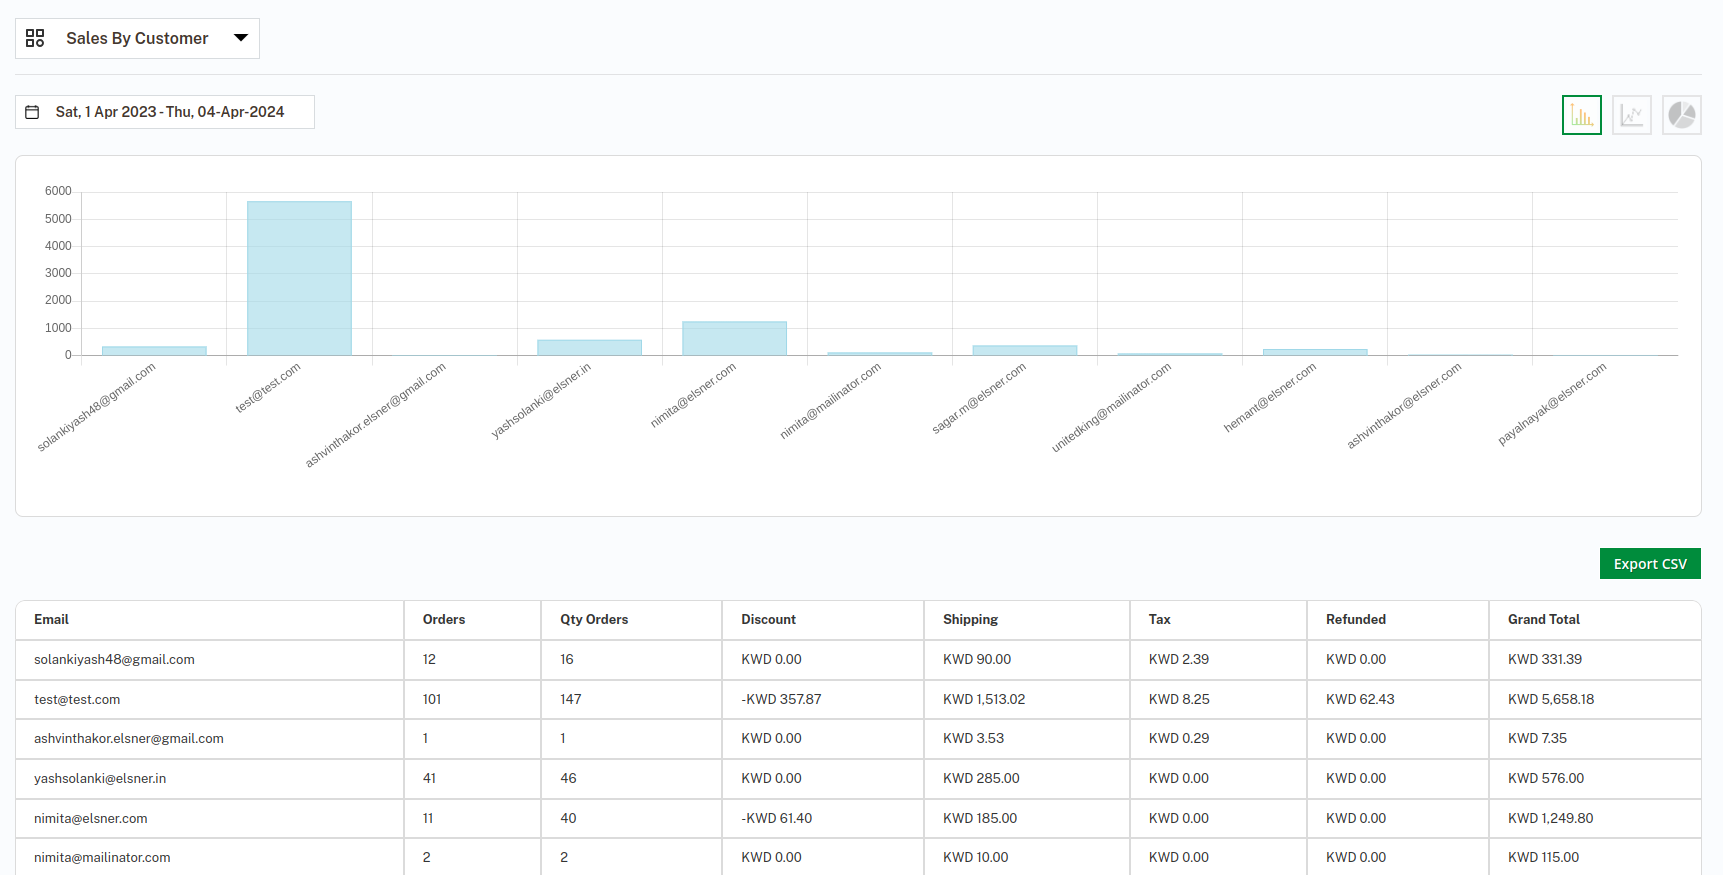
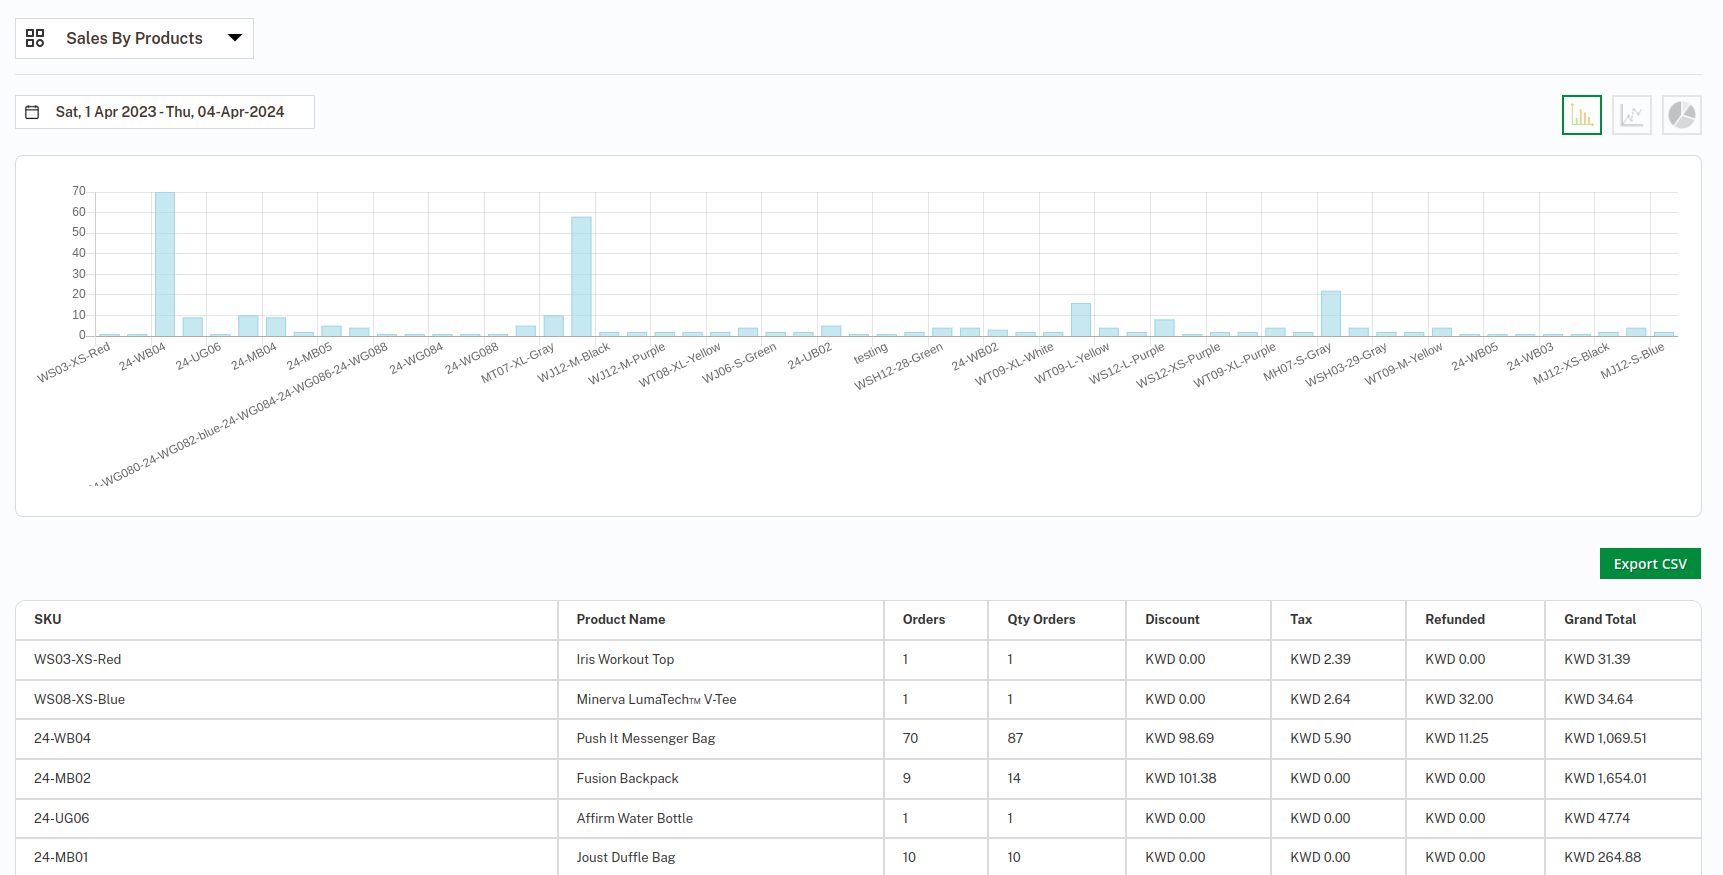
2. Reports View-Granular access to detailed reports on various aspects of your store. This can include sales by product, customer, category, marketing channel, etc.
Benefits-Deep dive into specific data points, identify trends, analyze performance across different areas.
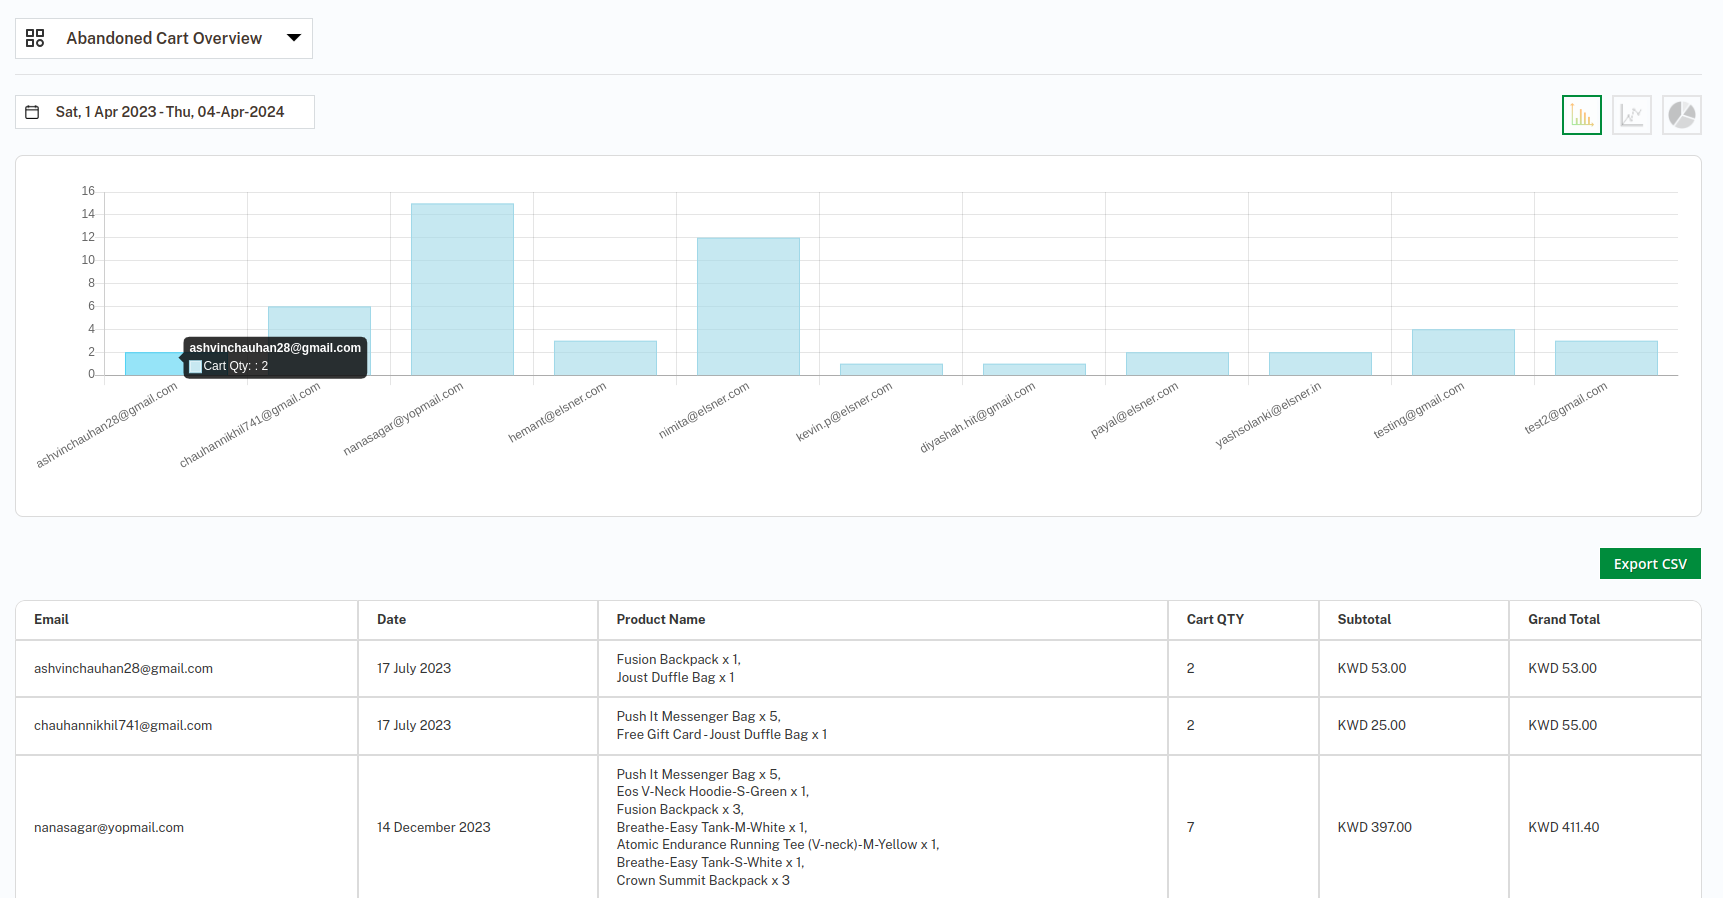
3. Cart Overview- Dedicated reports and visualizations to analyze abandoned cart data. Track cart abandonment rates, identify reasons for abandonment, and understand customer behavior during checkout.
Benefits-Reduce cart abandonment, improve conversion rates, optimize checkout process.
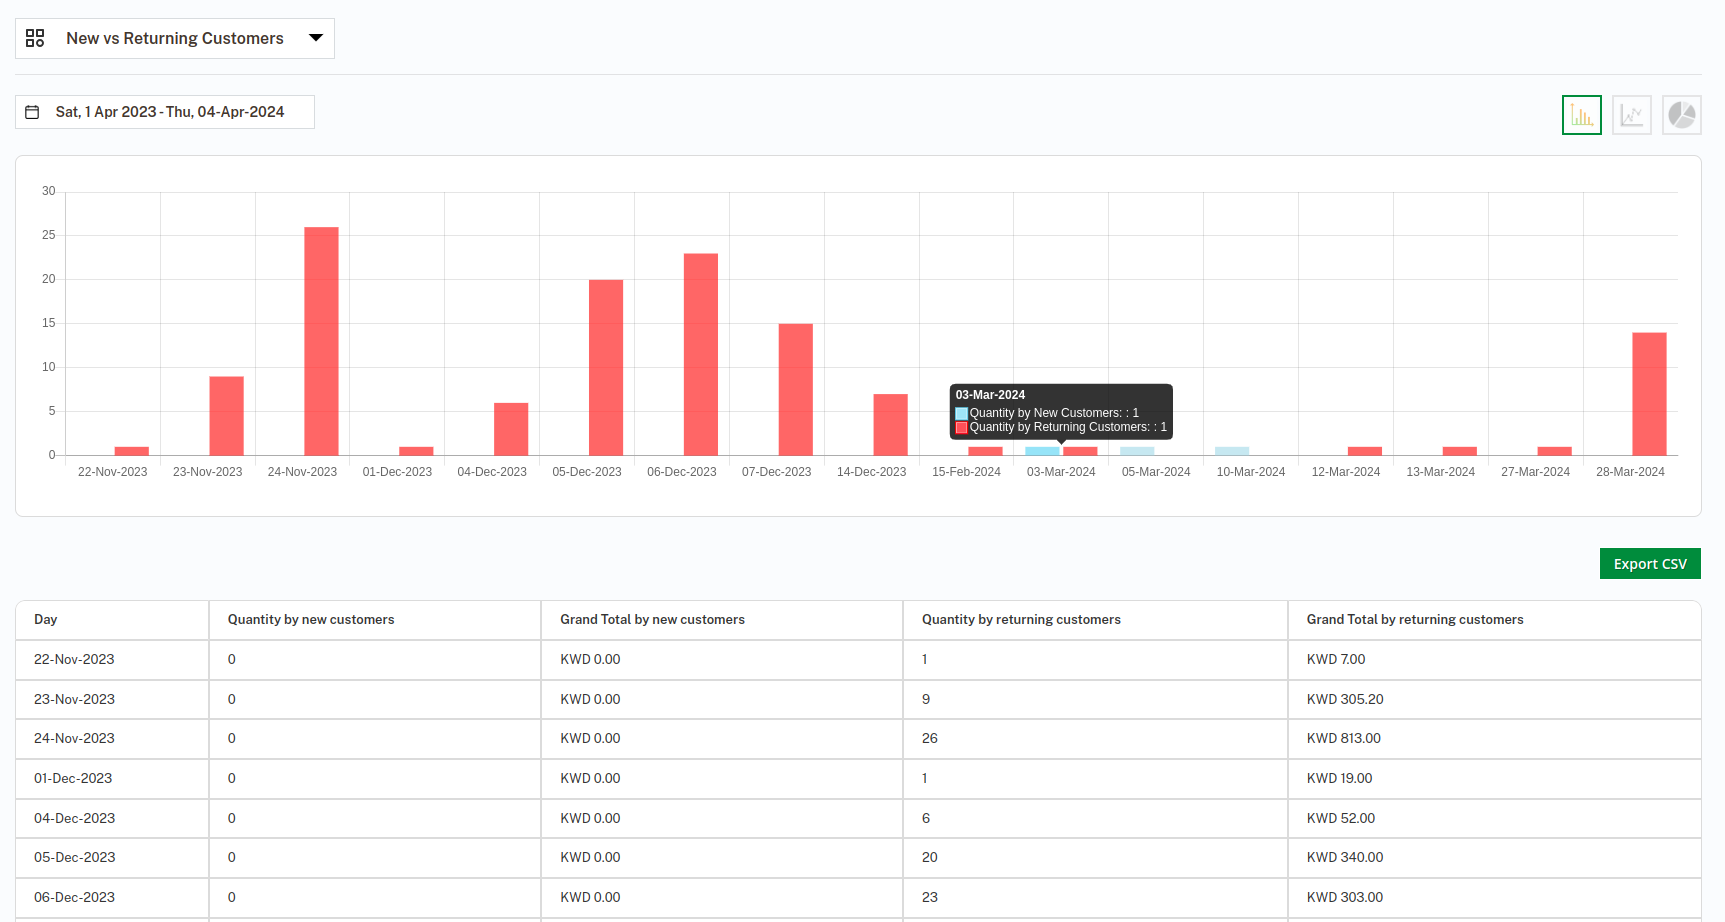
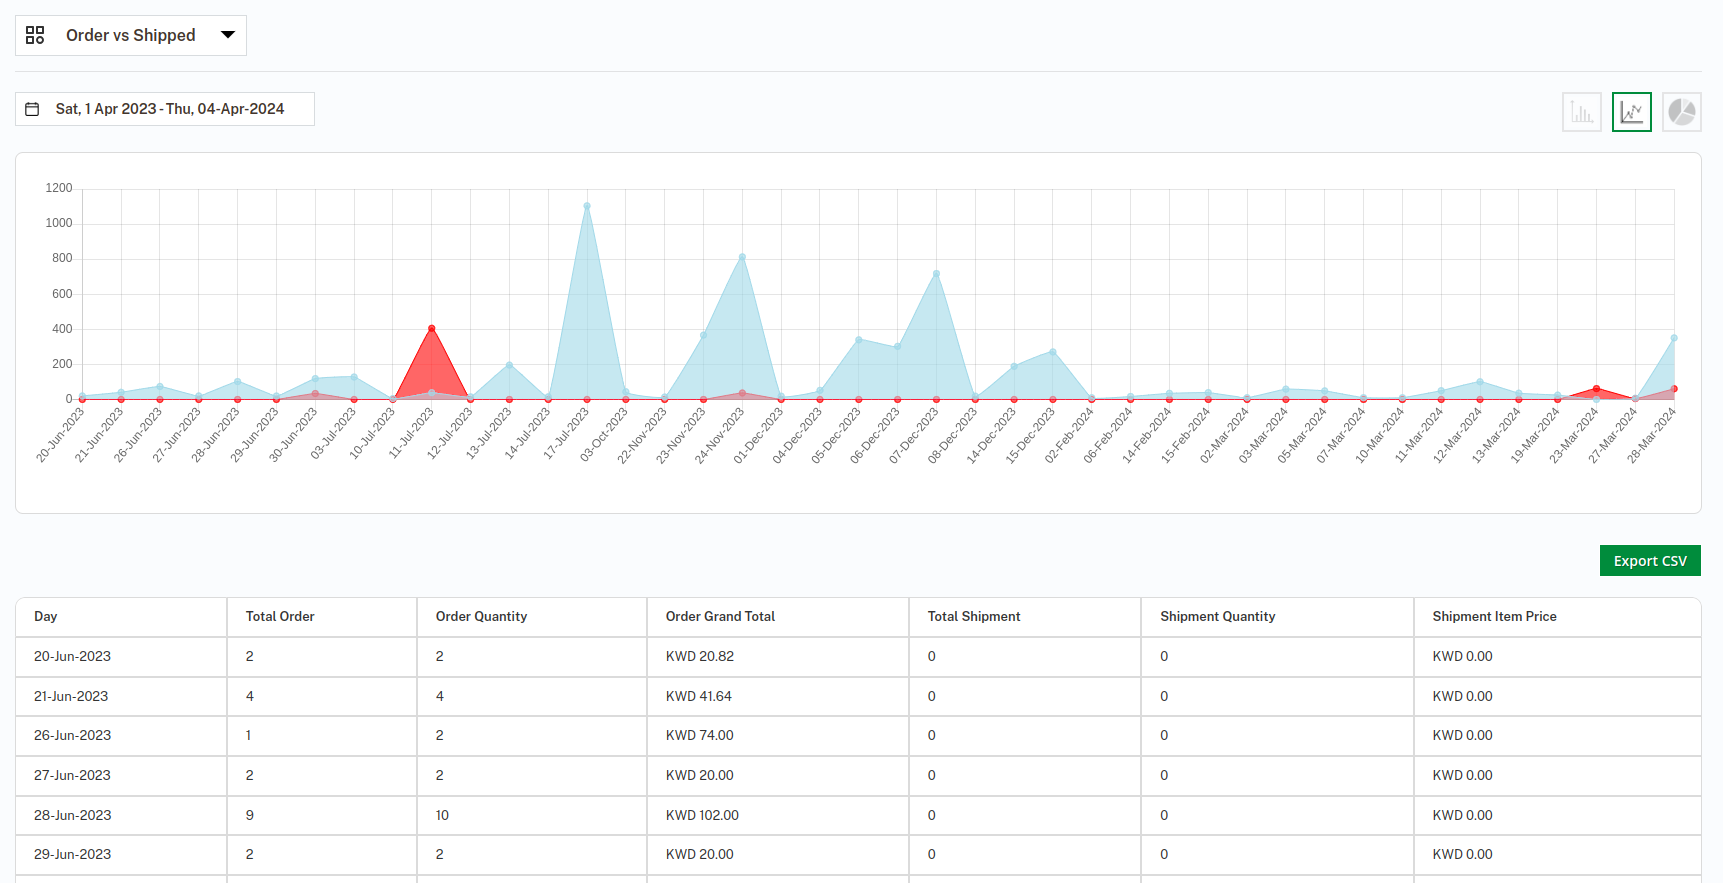
4. Comparison Charts-Interactive charts and graphs to compare key metrics over time or across different segments. This allows you to visualize trends, identify patterns, and measure the effectiveness of marketing campaigns..
Benefits-Gain visual insights, understand performance changes, track progress towards goals.
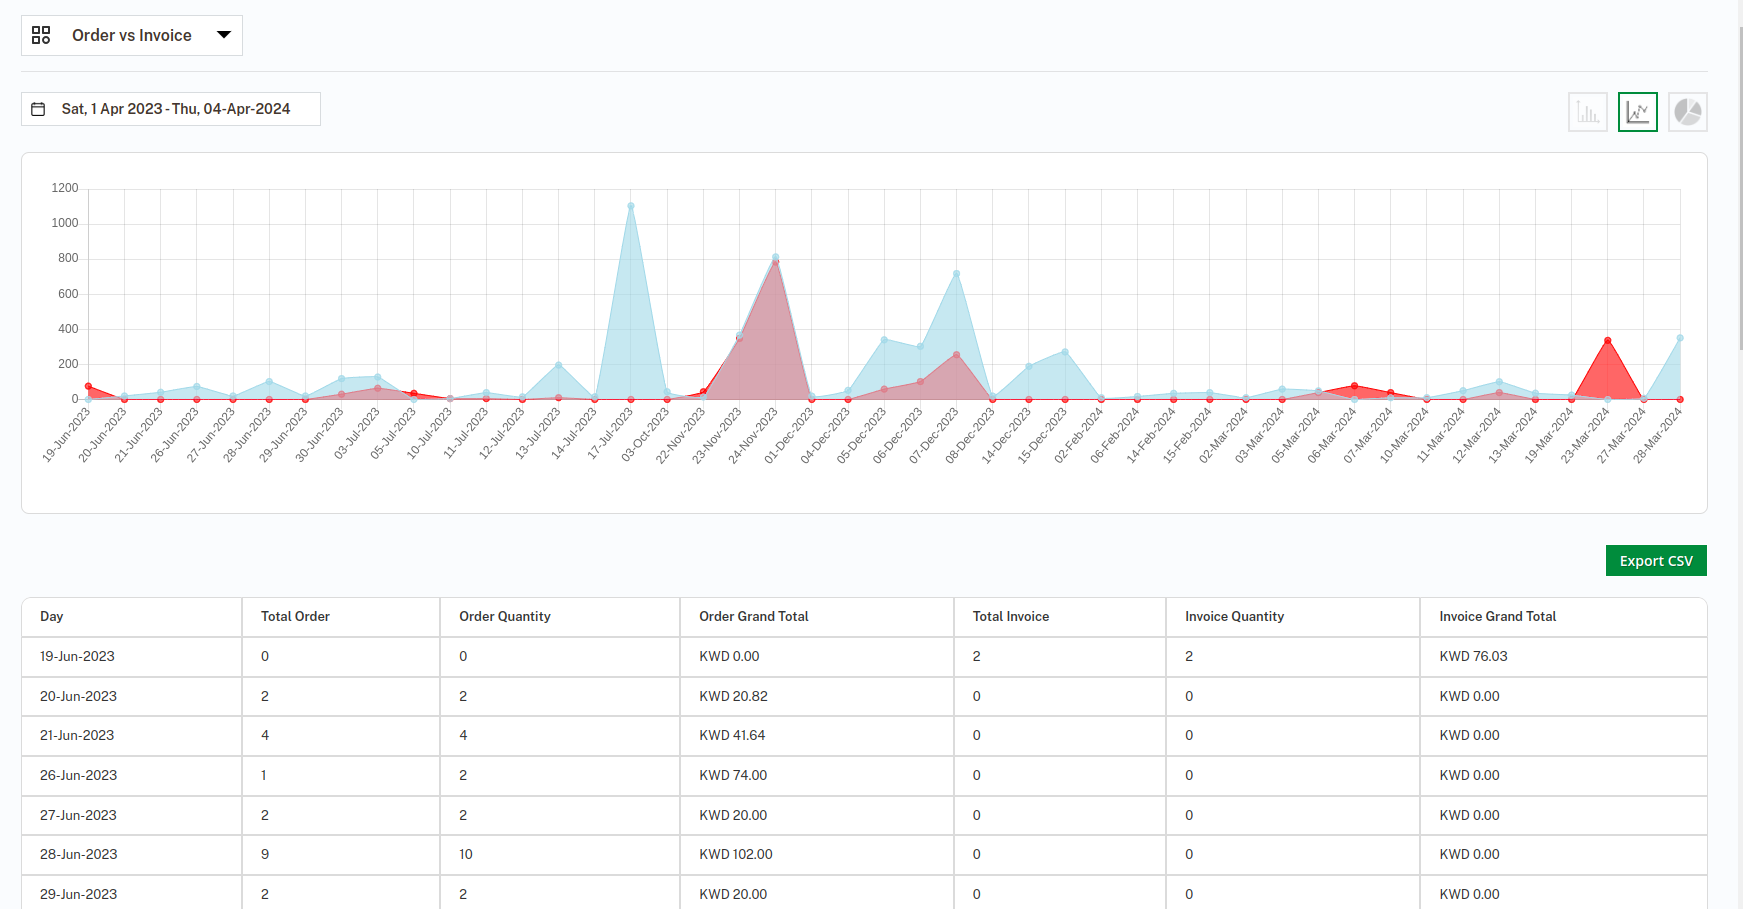
5. Different Chart Views- Flexibility to display data in various chart formats like bar charts, pie charts, line charts, and more. This allows you to choose the most appropriate visual representation for different data sets.
Benefits-Tailored data visualization, easier data interpretation, and cater to different user preferences.
Key Features
What Features your Extension Lacks?
Details
Gain a crystal-clear view of your business. Analyze trends, identify opportunities, and make data-driven decisions to improve your bottom line. Explore a comprehensive library of reports covering critical areas like sales, customers, products, marketing campaigns, and inventory. With Magento 2 Advanced Reporting, you'll have the information you need to make informed choices and drive growth for your online store.
Transform complex data into actionable insights. Don't settle for surface-level information. Drill down into reports to uncover hidden patterns and customer behavior. Our extension presents information in visually appealing formats like charts, graphs, and heatmaps, making it easy to understand trends and identify areas for improvement at a glance.
Effortlessly customize your reporting experience. Tailor reports to your specific needs. Set custom time frames, apply filters to focus on relevant data points, and personalize reports to match your unique business objectives. Create custom dashboards that display the most critical KPIs for your business. Gain a real-time snapshot of your store's health and monitor key metrics at your fingertips.
1. Readymade Dashboard-Pre-configured dashboards with essential KPIs (Key Performance Indicators) for sales, marketing, inventory, and customer behavior. This provides a quick and easy overview of your store's performance without needing to build custom reports.
Benefits-Saves time, provides immediate insights, streamlines decision-making.
2. Reports View-Granular access to detailed reports on various aspects of your store. This can include sales by product, customer, category, marketing channel, etc.
Benefits-Deep dive into specific data points, identify trends, analyze performance across different areas.
3. Cart Overview- Dedicated reports and visualizations to analyze abandoned cart data. Track cart abandonment rates, identify reasons for abandonment, and understand customer behavior during checkout.
Benefits-Reduce cart abandonment, improve conversion rates, optimize checkout process.
4. Comparison Charts-Interactive charts and graphs to compare key metrics over time or across different segments. This allows you to visualize trends, identify patterns, and measure the effectiveness of marketing campaigns..
Benefits-Gain visual insights, understand performance changes, track progress towards goals.
5. Different Chart Views- Flexibility to display data in various chart formats like bar charts, pie charts, line charts, and more. This allows you to choose the most appropriate visual representation for different data sets.
Benefits-Tailored data visualization, easier data interpretation, and cater to different user preferences.
